kottke.org posts about maps
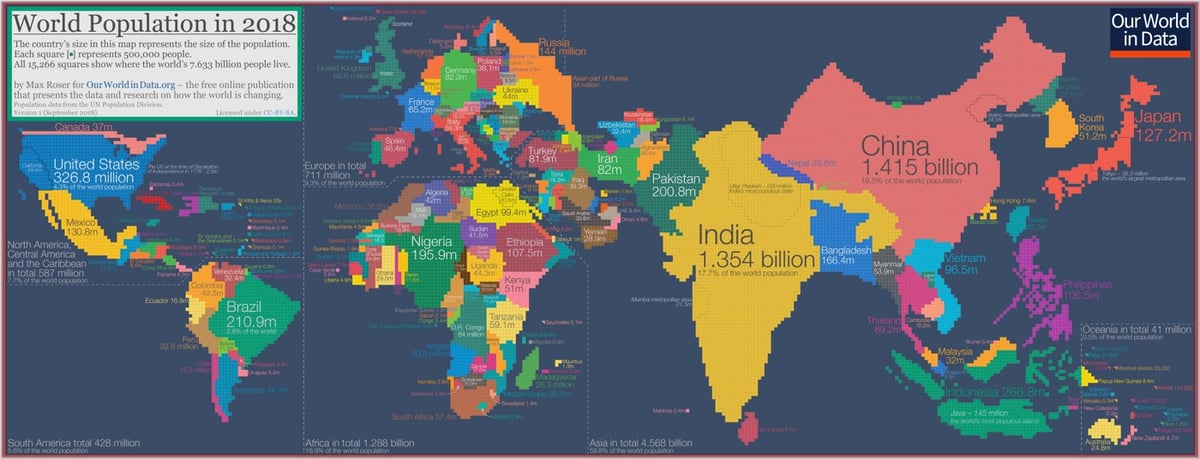
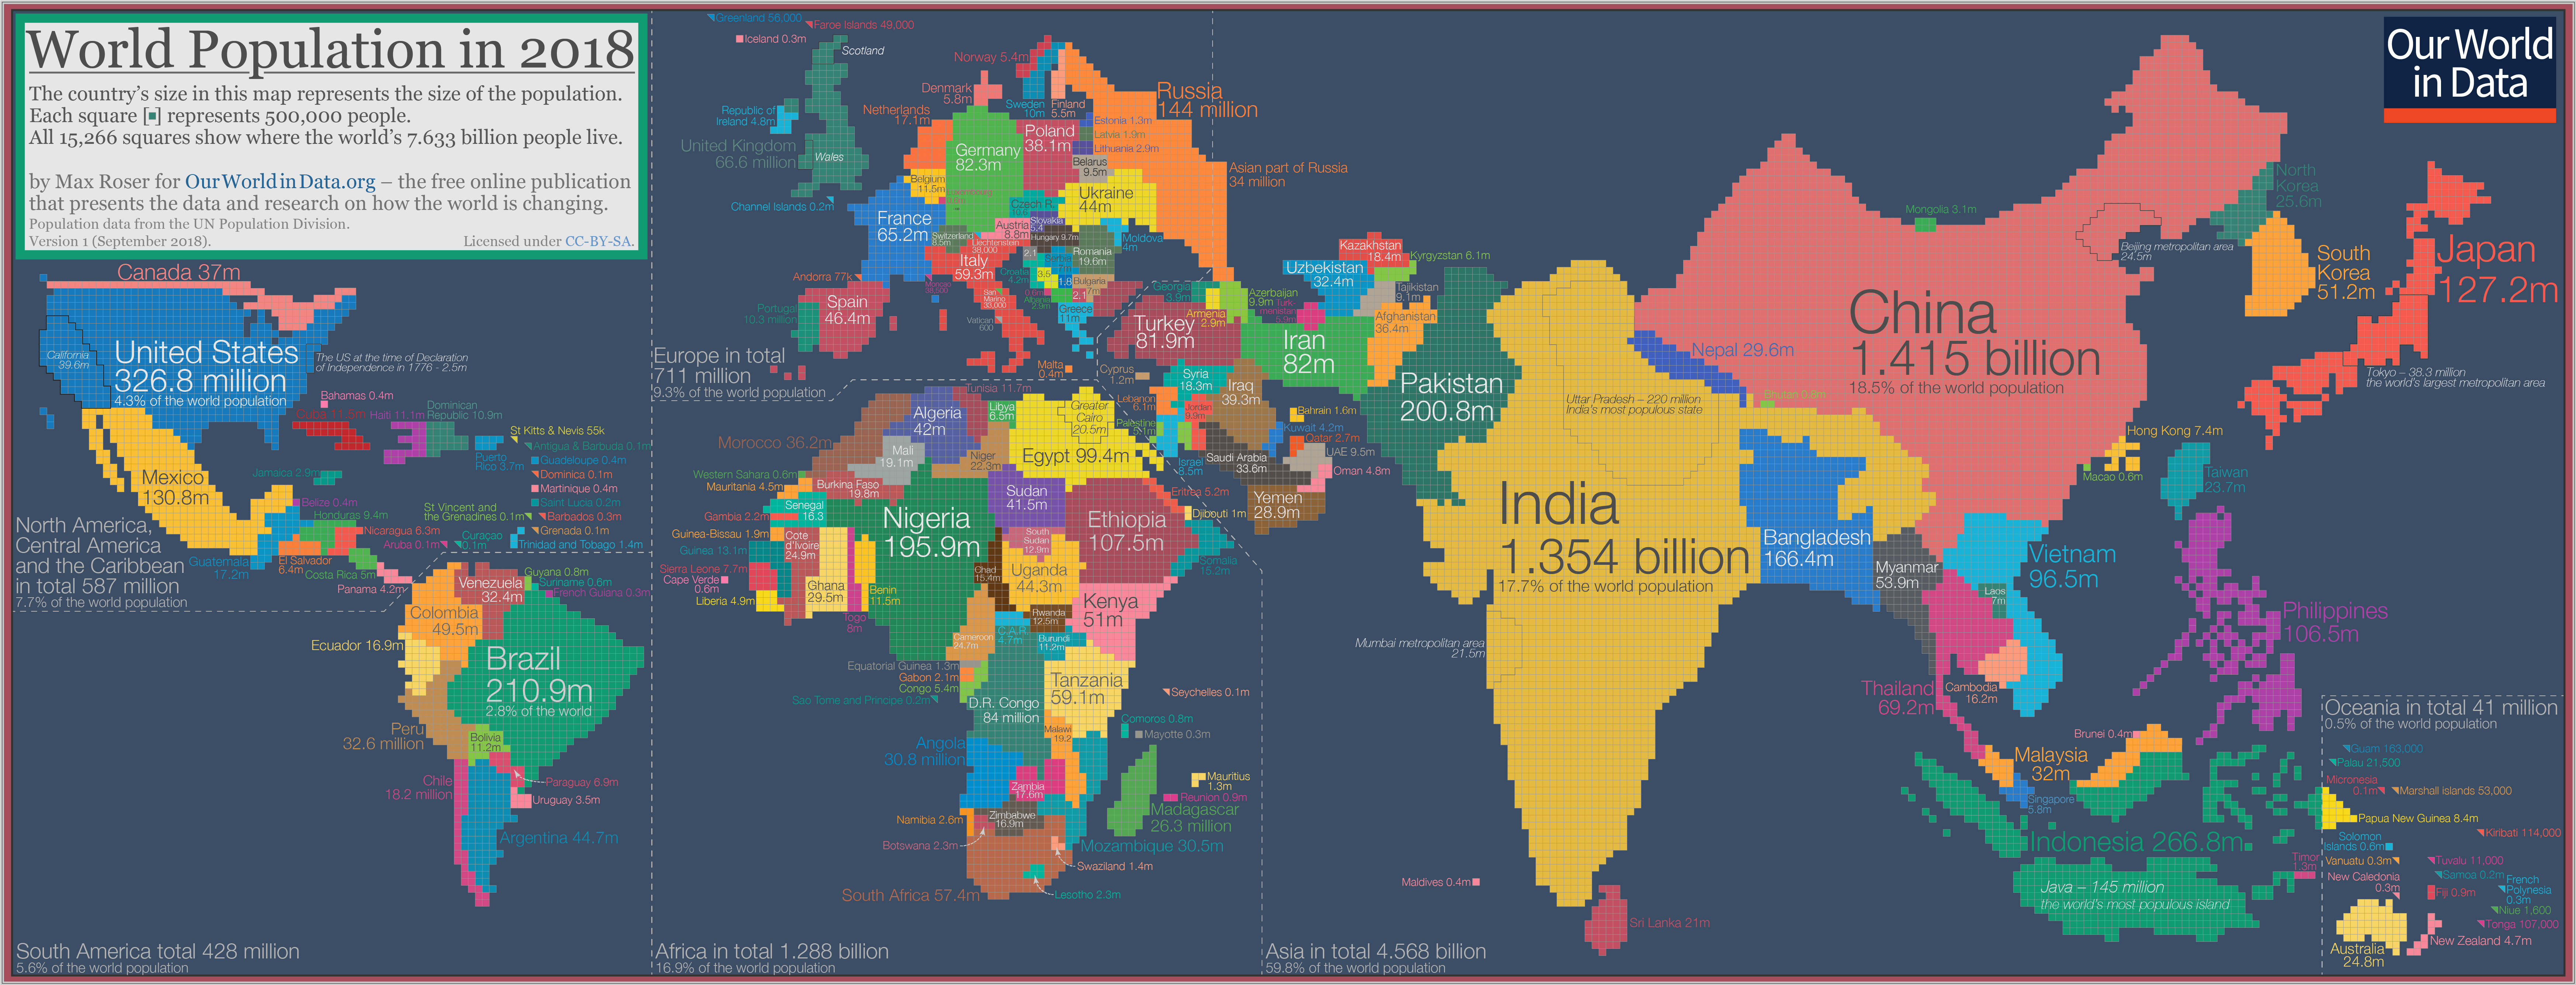
Max Roser has constructed a cartogram of the world where the size of the countries are determined by their populations (big version of the image here). He refers to it as “the map we need if we want to think about how global living conditions are changing”.
The cartogram is made up of squares, each of which represents half a million people of a country’s population. The 11.5 million Belgians are represented by 23 squares; the 49.5 million Colombians are represented by 99 squares; the 1.415 billion people in China are represented by 2830 squares; and this year’s entire world population of 7.633 billion people is represented by the total sum of 15,266 squares.
As the size of the population rather than the size of the territory is shown in this map you can see some big differences when you compare it to the standard geographical map we’re most familiar with. Small countries with a high population density increase in size in this cartogram relative to the world maps we are used to — look at Bangladesh, Taiwan, or the Netherlands. Large countries with a small population shrink in size — talking about you Canada, Mongolia, Australia, and Russia.
Some observations (Roser has many more if you click through):
1. Look at how teeny Russia is. (So is Canada.)
2. Seriously, Bangladesh, Pakistan, Nigeria, Indonesia, and Brazil all have larger populations than Russia. Japan, Ethiopia, and Mexico are very close.
3. 60% of the world’s population lives in Asia.
4. 5 times as many people live in Madagascar as do Ireland. The populations of Ireland + the Scandinavian countries = the population of Peru.
5. Europe is tiny. Guns, Germs, and Steel, yo.
6. India and China. Damn.
I would love to see an animated version of this cartogram from like 1950 to 2100 (like this one of the US).
Update: Jakub Nowosad built an animated map of the world’s population changes from 1800-2100 and documented the steps so you can make your own variation.
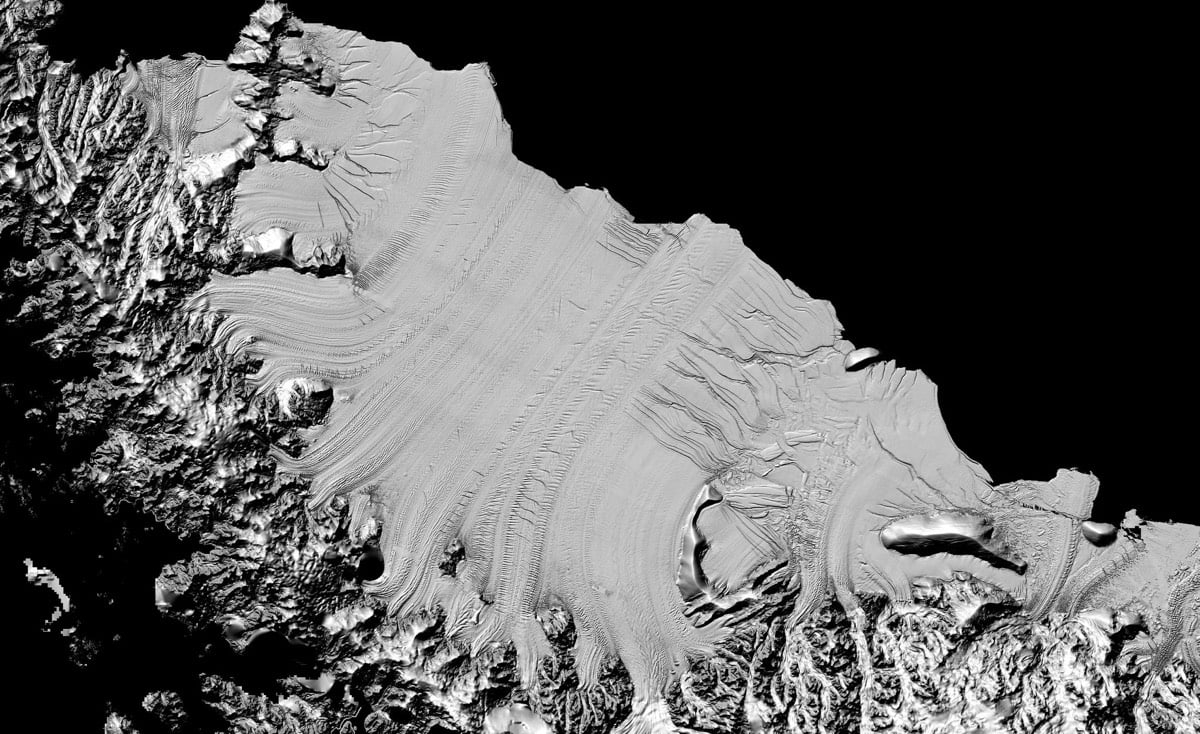
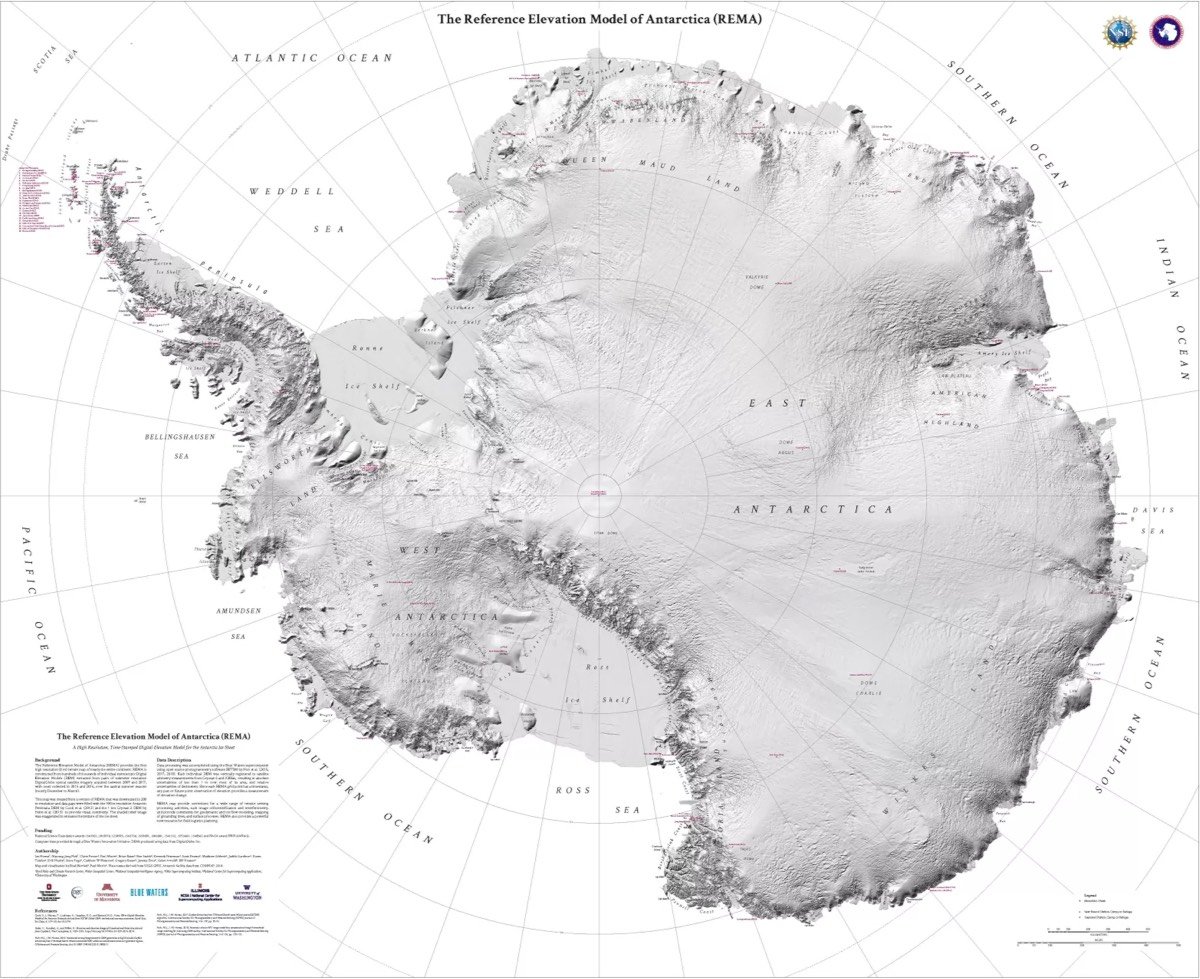
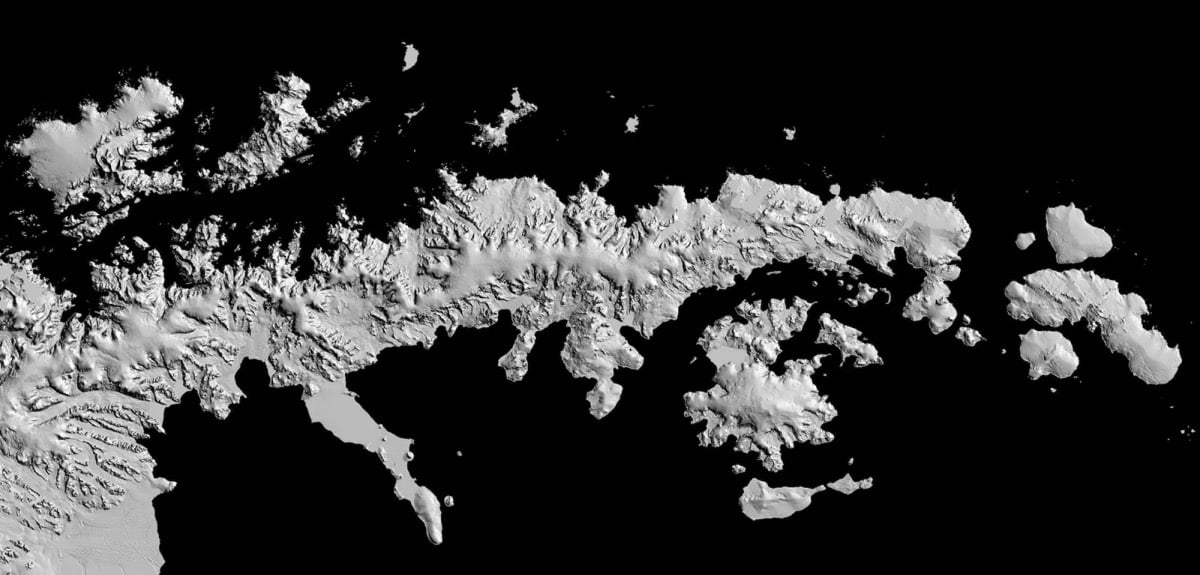
Using years of satellite data and photography, researchers have constructed an extremely detailed terrain map called the Reference Elevation Model of Antarctica that maps 98% of the continent down to a resolution of 8 meters. That makes it the most detailed terrain map of any continent. The NY Times has the skinny on the new map.
Previous maps of the continent had a resolution similar to seeing the whole of Central Park from a satellite. With this new data, it is now possible to see down to the size of a car, and even smaller in some areas. The data is so complete that scientists now know the height of every feature on the continent down to a few feet.
“If you’re someone that needs glasses to see, it’s a bit like being almost blind and putting on glasses for the first time and seeing 20/20,” said Dr. Howat.
The team used 187,585 images collected over six years to create the map.
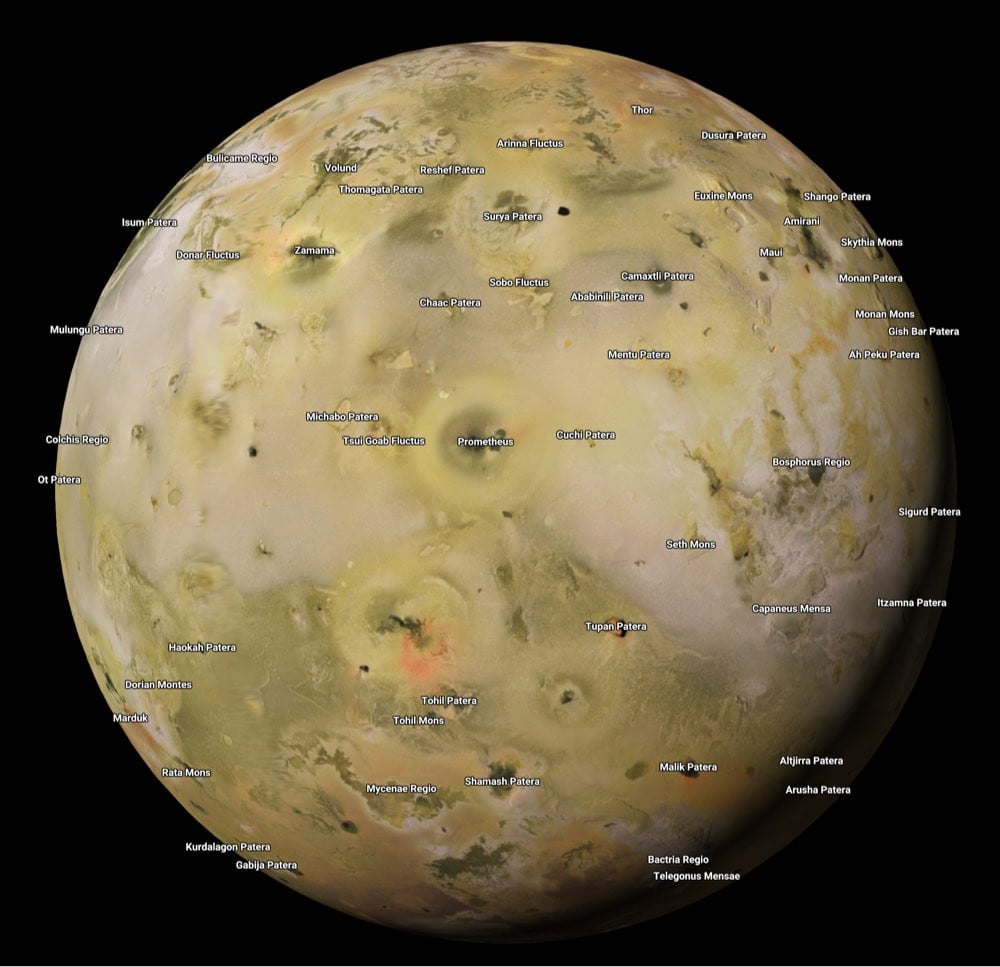
“Until now, we’ve had a better map of Mars than we’ve had of Antarctica,” said Dr. Howat.
Published by the North American Cartographic Information Society, the upcoming 2018 Atlas of Design showcases 32 of the best maps made over the past 2 years. Atlas Obscura has a selection of maps featured in the book.
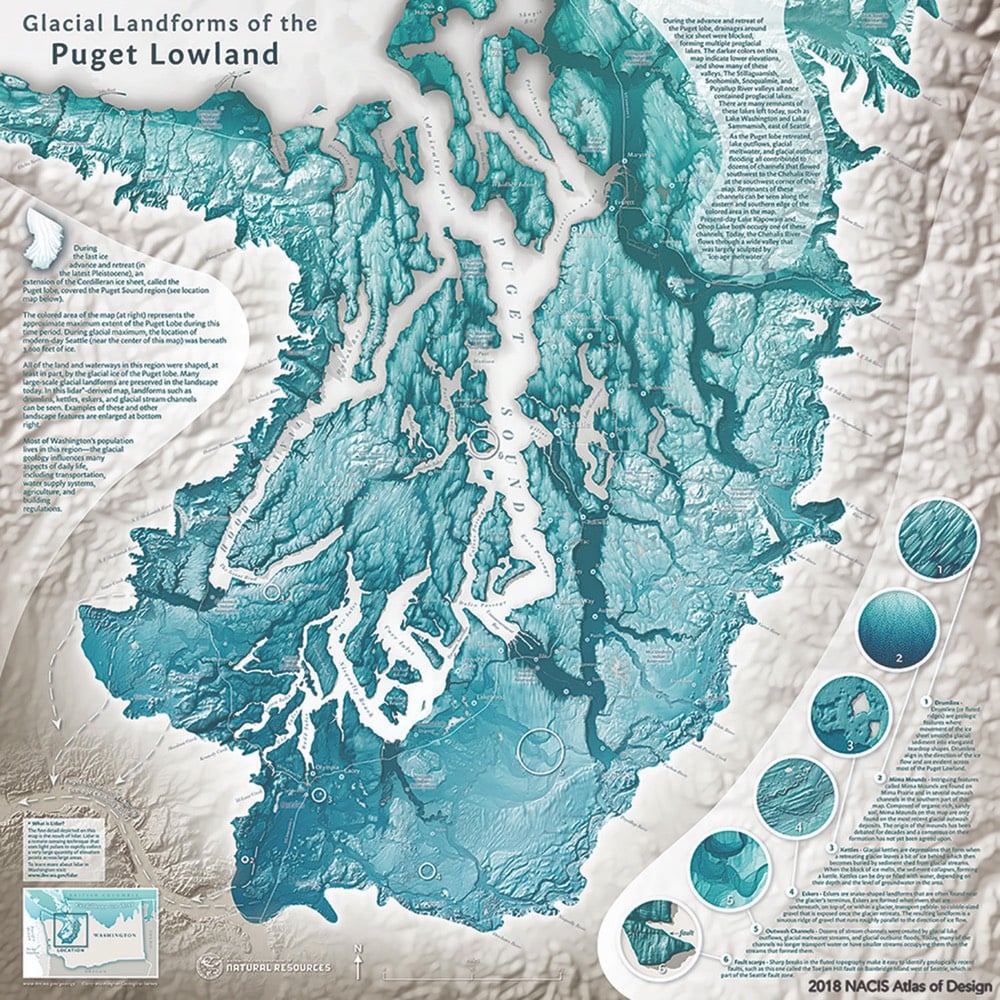
You can preorder the book here or view a list of all the maps and their designers included in the book.
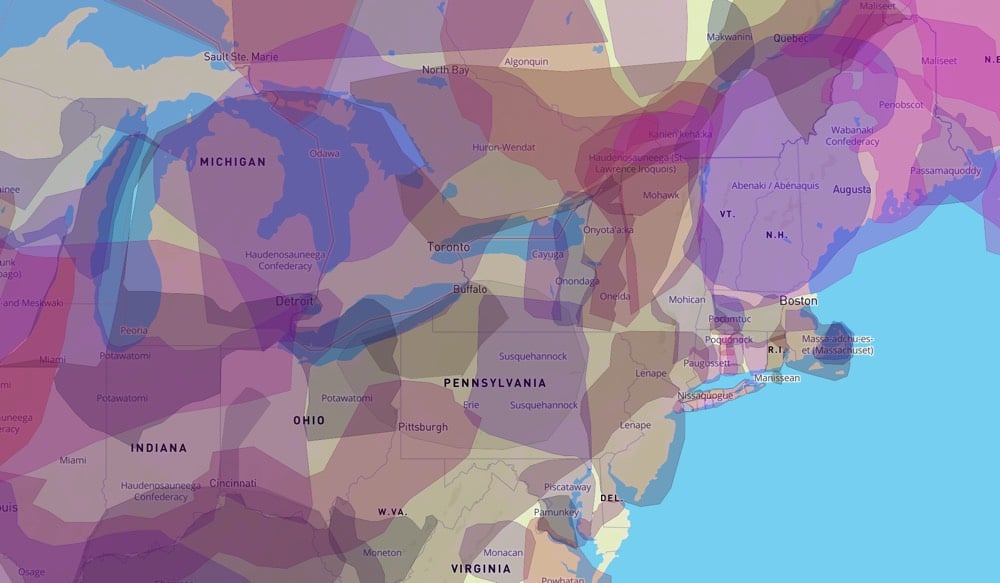
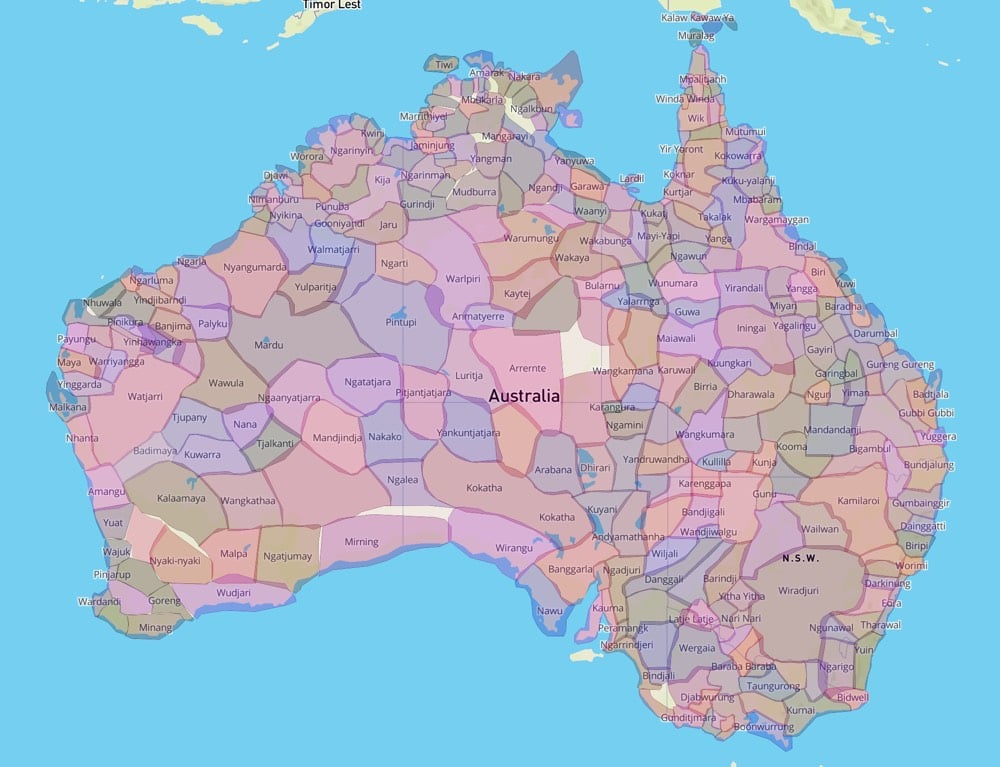
The Native Land site is a collaborative effort to map the approximate boundaries of the territories and languages of the indigenous nations in the Americas, Australia, and New Zealand.
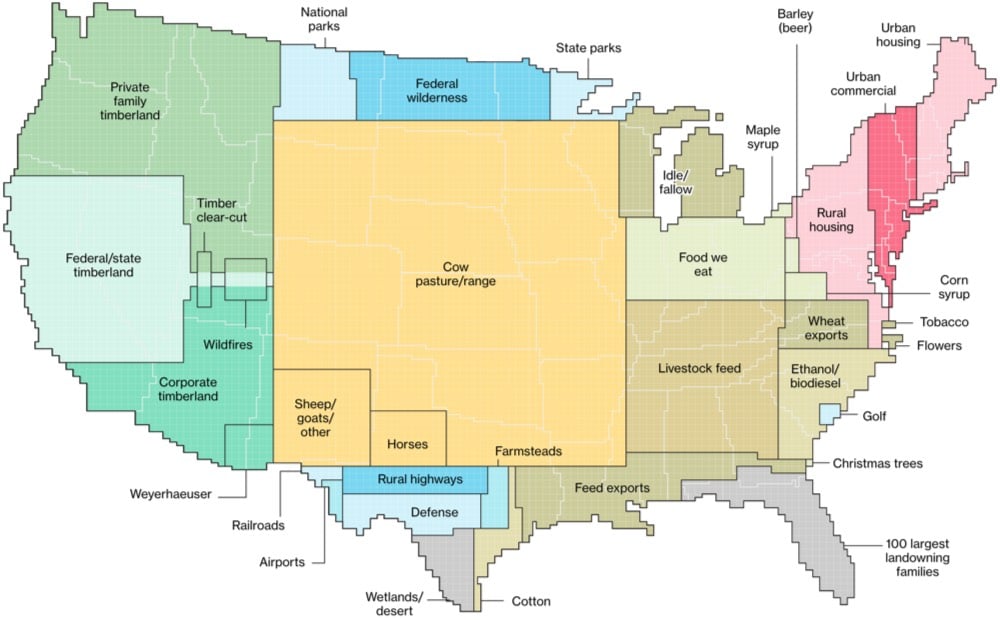
Here’s How America Uses Its Land is a nice presentation by Bloomberg on land use in the US. The land and resources used for livestock makes a great case for Americans eating more vegetarian.
More than one-third of U.S. land is used for pasture — by far the largest land-use type in the contiguous 48 states. And nearly 25 percent of that land is administered by the federal government, with most occurring in the West. That land is open to grazing for a fee.
There’s a single, major occupant on all this land: cows. Between pastures and cropland used to produce feed, 41 percent of U.S. land in the contiguous states revolves around livestock.
Urban areas take up relatively less space but are growing the fastest. And only 100 people own a space the size of Florida? Wow.
On a percentage basis, urban creep outpaces growth in all other land-use categories. Another growth area: land owned by wealthy families. According to The Land Report magazine, since 2008 the amount of land owned by the 100 largest private landowners has grown from 28 million acres to 40 million, an area larger than the state of Florida.
It would be interesting to see this data sliced and diced in a few different ways. I’d love to see land use by state or area of the country or how much each category is growing or shrinking, with projections 5, 10, 20 years into the future.
This is a map showing the spread of the cultivation of crops across Europe.
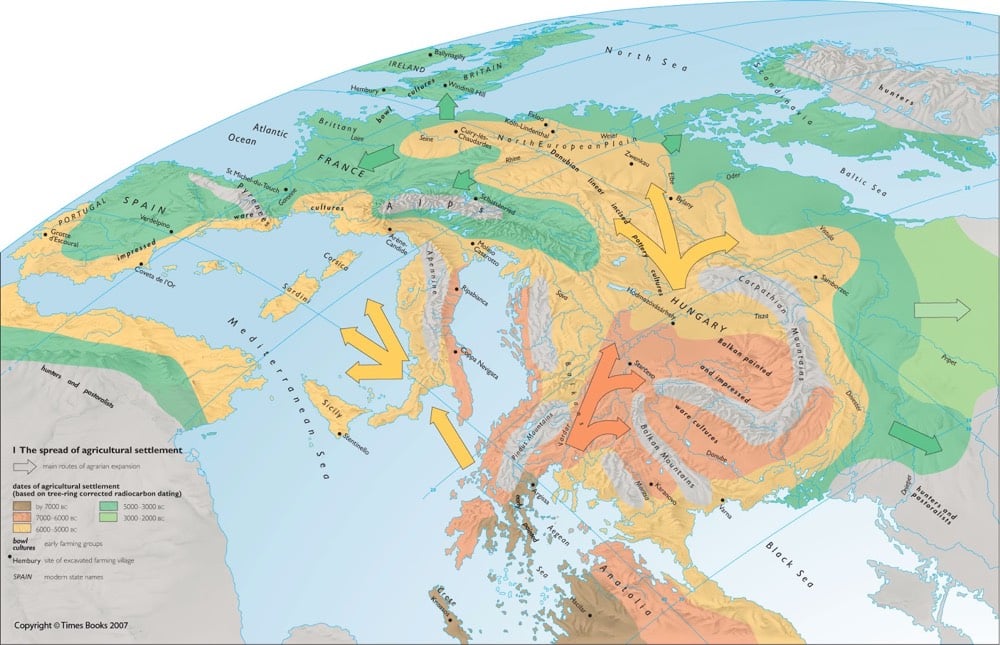
The legend is a bit hard to read, but the map indicates that it took ~2000-4000 years for farming to spread from Turkey to Britain. Several thousand years later, the Industrial Revolution boomeranged back out from Britain across Europe:
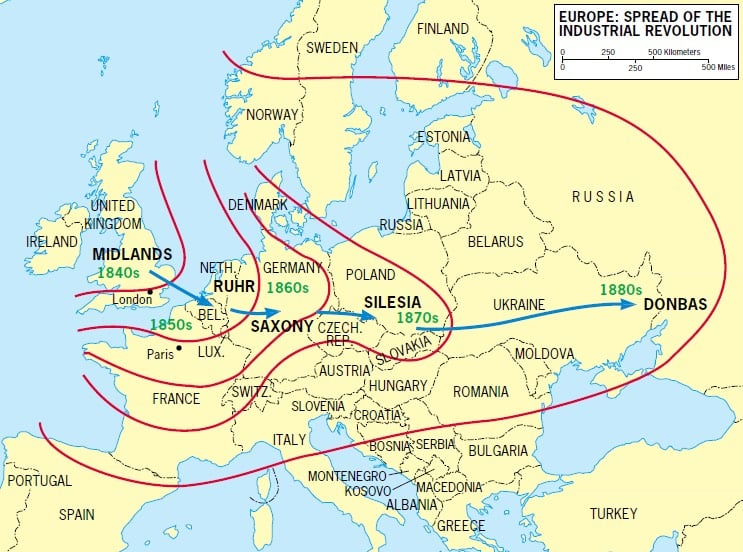
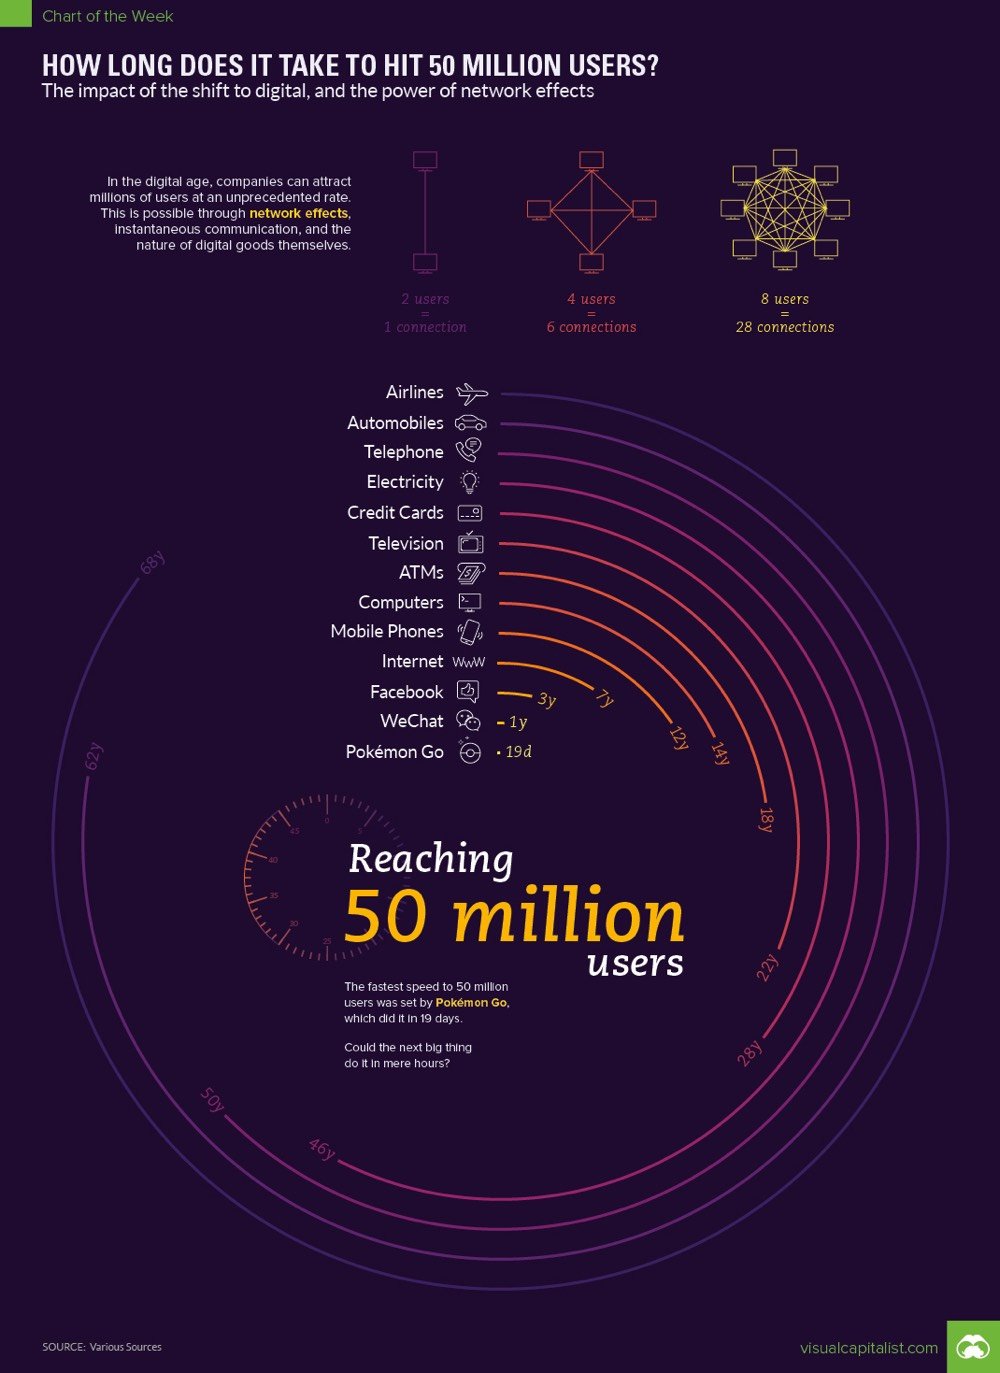
The dates and areas on both of these maps are rough & approximate1 but the important thing to notice here is the acceleration of the pace of technology. The technology of farming (seeds, techniques, tools, etc.) took thousands of years to spread across Europe but the expansion of industrial technology happened on the order of decades in the mid 19th century. That’s an incredible quickening.
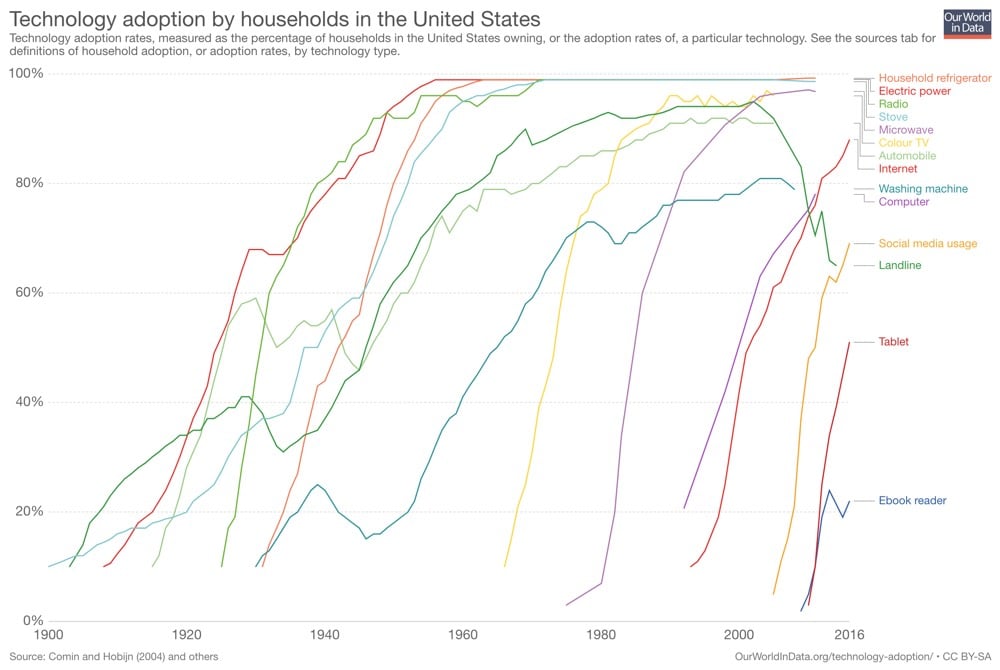
And now? Seconds.2 An app launched in China can be downloaded moments later in a cottage in England or a cabin in Quebec and cutting edge scientific papers published in Brazil can be accessed almost instantaneously in India or Kenya. That’s fast enough that plotting it on a map doesn’t make sense…charts like these tell the story of technology adoption much better:
Urban data scientist Geoff Boeing graphed the orientation of the streets in 50 cities from around the world. Here are 10 cities from his analysis:
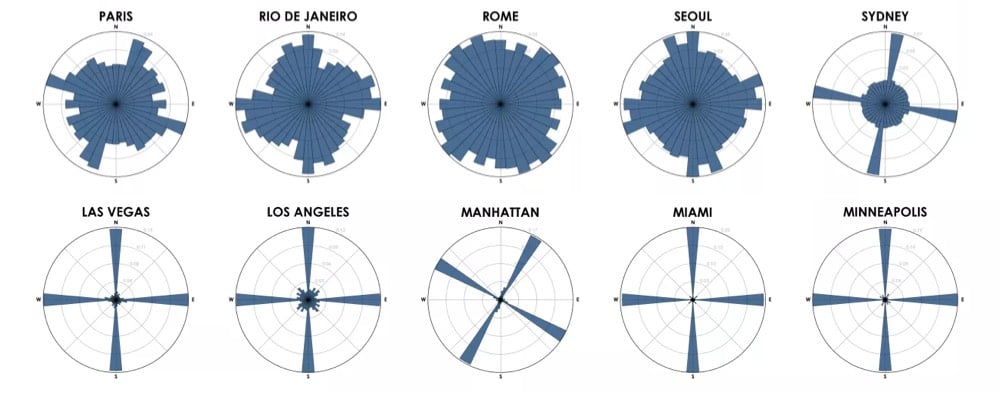
How to read the graphs:
Each of the cities above is represented by a polar histogram (aka rose diagram) depicting how its streets orient. Each bar’s direction represents the compass bearings of the streets (in that histogram bin) and its length represents the relative frequency of streets with those bearings.
Looking at these graphs, you get a real sense of just how planned American cities are compared to much of the rest of the world, where cities grew more organically over longer periods of time. (Although I’m curious to see what the graph for all of NYC would look like…a bit more like Boston perhaps.)
Update: Using Mapbox, you can generate street orientation charts for any map view. I used it to verify that north-south roads outnumber east-west roads in New England, which is why it takes so long to go 30 miles across VT compared to up or down.
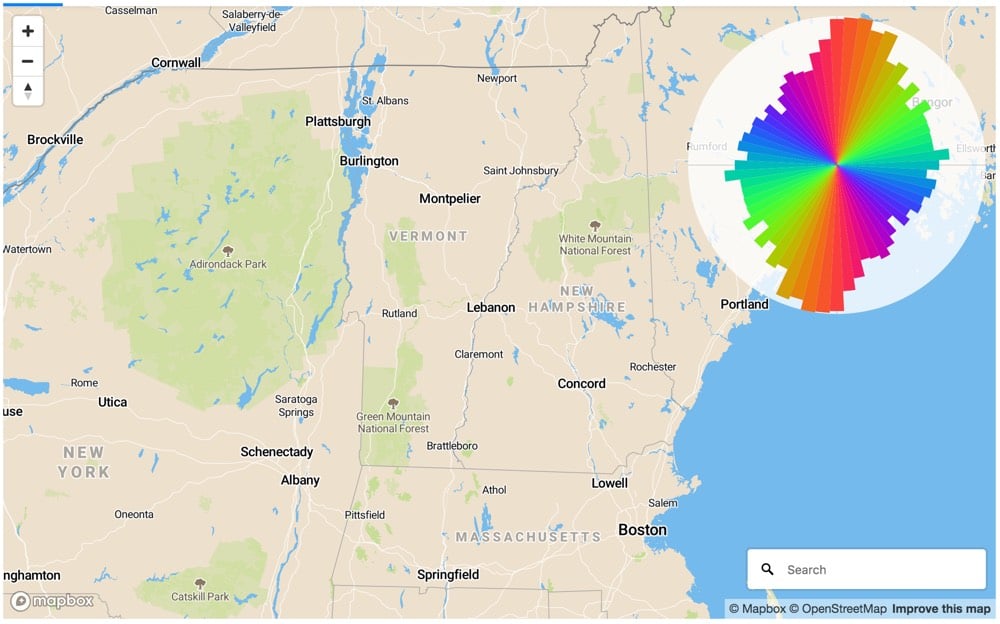
(via @dokas)
Americans generally have a skewed view of their country’s place in the world, both metaphorically and geographically speaking. For instance, the US state closest to Africa is… Maine? And Minneapolis is as far north as Venice, Italy.
They didn’t cover my favorite US geographical oddity though: what’s the northernmost state in the contiguous 48 states? Unless you know it by rote, the answer will probably be surprising to you.
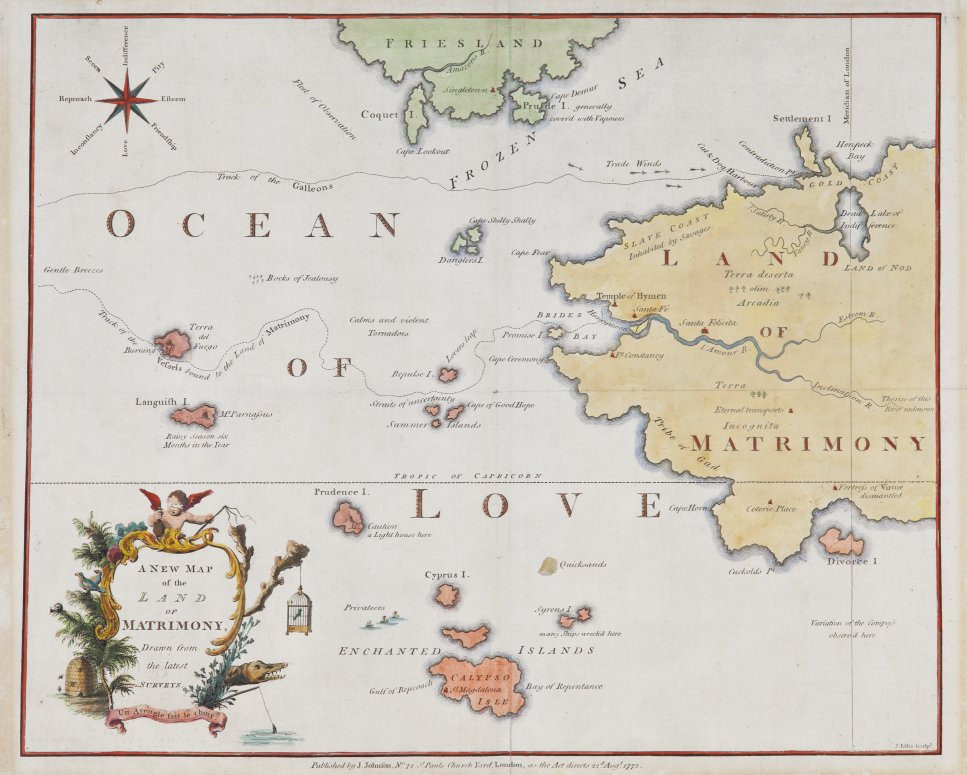
The Land of Matrimony, 1772
The Public Domain Review has an interesting collection of allegorical maps of love, courtship, and marriage, in multiple languages and styles, from the 17th to the 19th century. I’m partial to this very early map, La Carte de tendre; “conceived by Madeleine de Scudéry for inclusion in her novel Clélie (1654-61) and engraved by François Chauveau.”
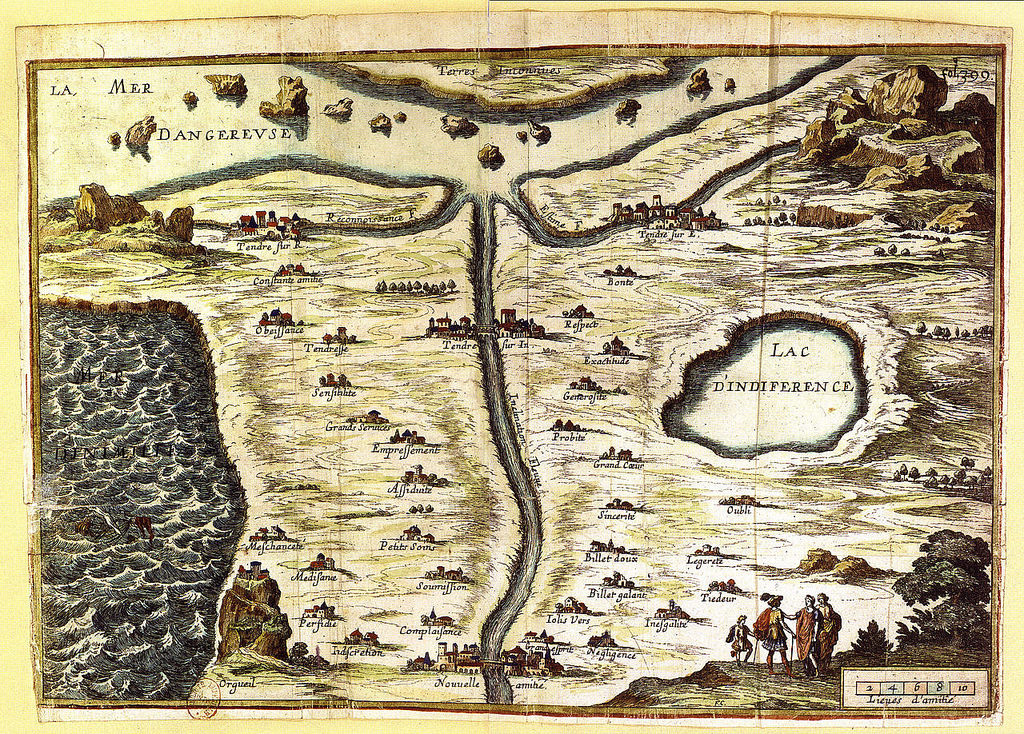
Here one can travel, by following the river of Inclination, from the town of Nouvelle Amitié (New Friendship) in the south to the town of Tendre (Love) in the north — that is if one can avoid the various pitfalls and obstacles which line the route, including the strangely inviting Lac D’Indiference (Lake of Indifference).
Maps were the memes of their time.
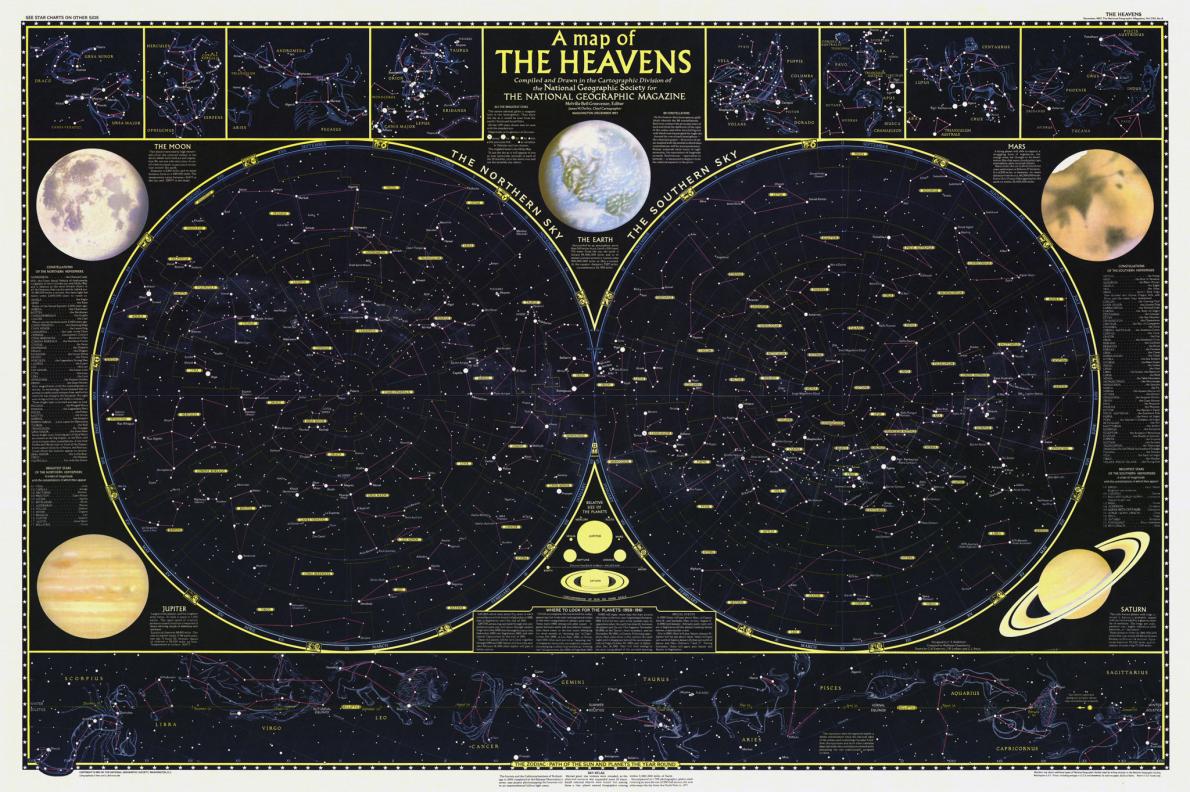
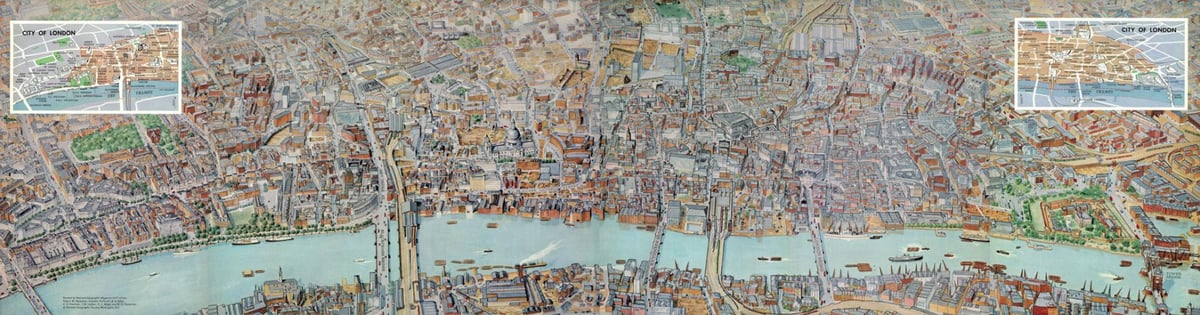
National Geographic is making digital copies of its century-plus archive of maps available to the public… with a twist. Immediate access to the full archive is subscriber-only. The rest of us get a new map a day, on Twitter, Instagram, or Facebook.
So you might get this gorgeous 1961 panorama of London, with individual hand-painted buildings…
… or you might get this 1894 sketch of Antarctica.
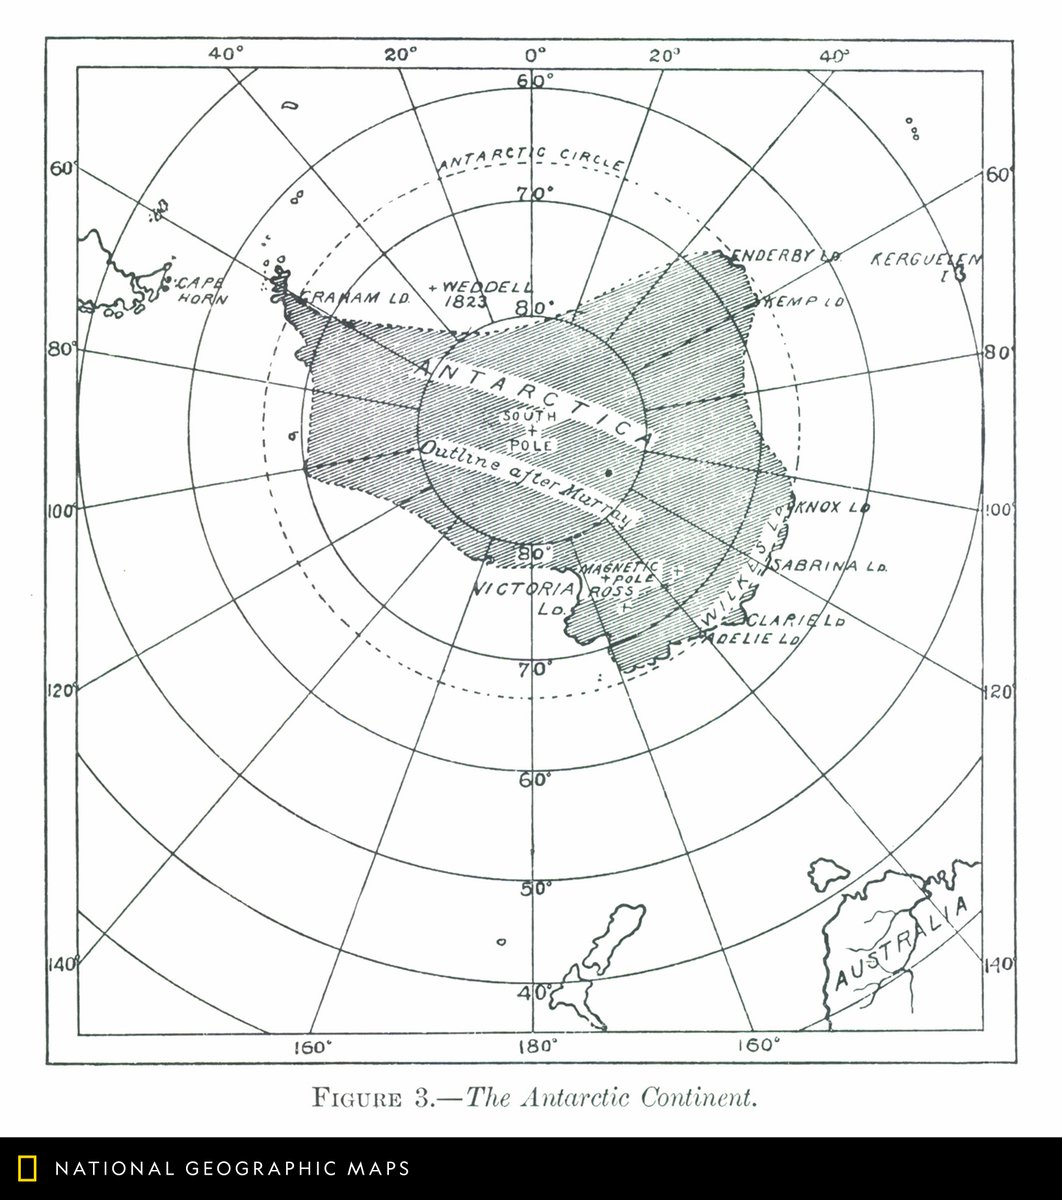
Which is not uninteresting, but it’s interesting for different reasons.
As a longtime advocate of digging in the crates, I have to applaud Nat Geo making creative use of its own archives. Even if the greedy part of me wants all the goodies at once.
Speaking of Pangaea, this video shows how the present-day continents came to be formed from the Pangaea supercontinent about 240 million years ago, then shows what the Earth’s surface might look like 250 million years in the future, if the tectonic plates continue to move in predictable ways.
I hope this explanation is helpful. Of course all of this is scientific speculation, we will have to wait and see what happens, but this is my projection based on my understanding of the forces that drive plate motions and the history of past plate motions. Remember: “The past reveals patterns; Patterns inform process; Process permits prediction.”
Look at how quickly India slams into the Asian continent…no wonder the Himalayas are so high.1 And it’s interesting that we’re essentially bookended by two supercontinents, the ancient Pangaea and Pangaea Proxima in the future.
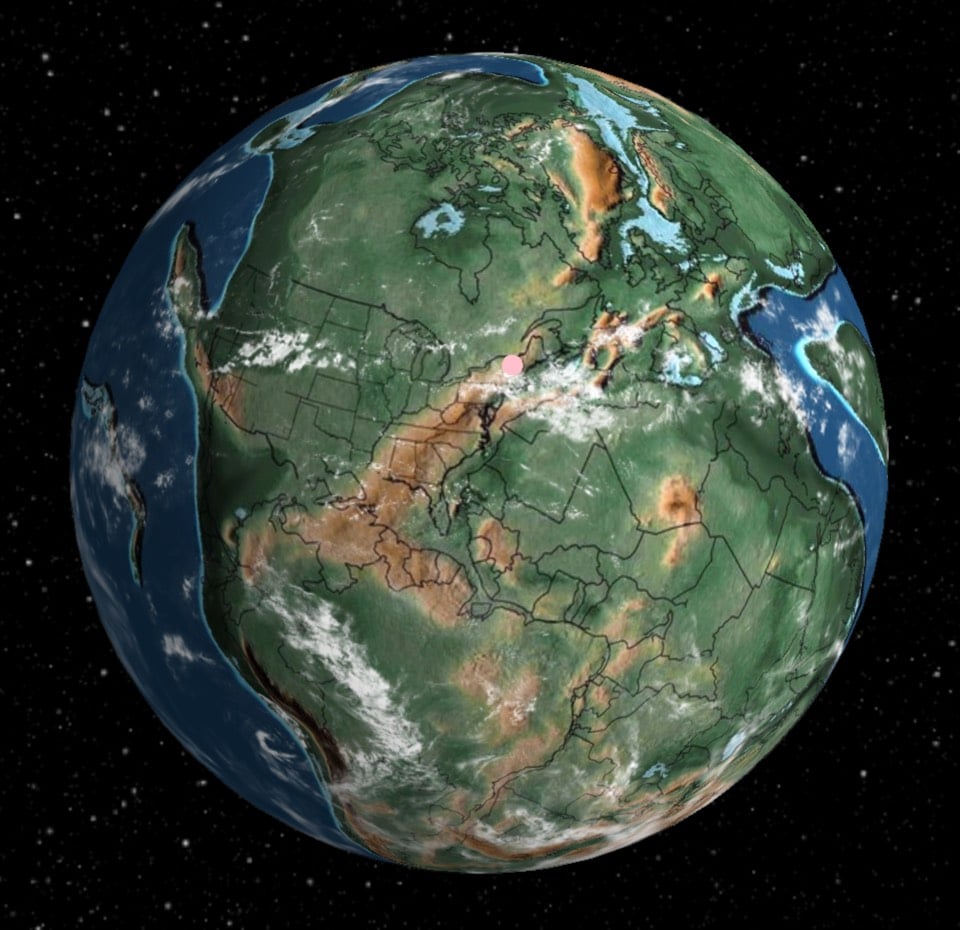
Ian Webster built a tool to plot modern addresses on a map of the Earth from up to 750 million years ago. Just input an address and it’ll find where that spot of land was on the Earth at a given time. The tool defaults to a view from 240 million years ago, smack in the middle of the Pangaea supercontinent era, but you can select views from 750 million years ago right up to the present. Webster explained a bit about the project on Hacker News:
I built this by adapting GPlates (https://www.gplates.org), an academic project providing desktop software for geologists to investigate plate tectonic data. I’m amazed that geologists collected enough data to actually plot my home 750M years ago, so I thought you all would enjoy it too.
Even though plate tectonic models return precise results, you should consider the plots approximate (obviously we will never be able to prove correctness). In my tests I found that model results can vary significantly. I chose this particular model because it is widely cited and covers the greatest length of time.
The visualization is open source and Webster is working on integrating the plate techtonics and location data into that repo soon.
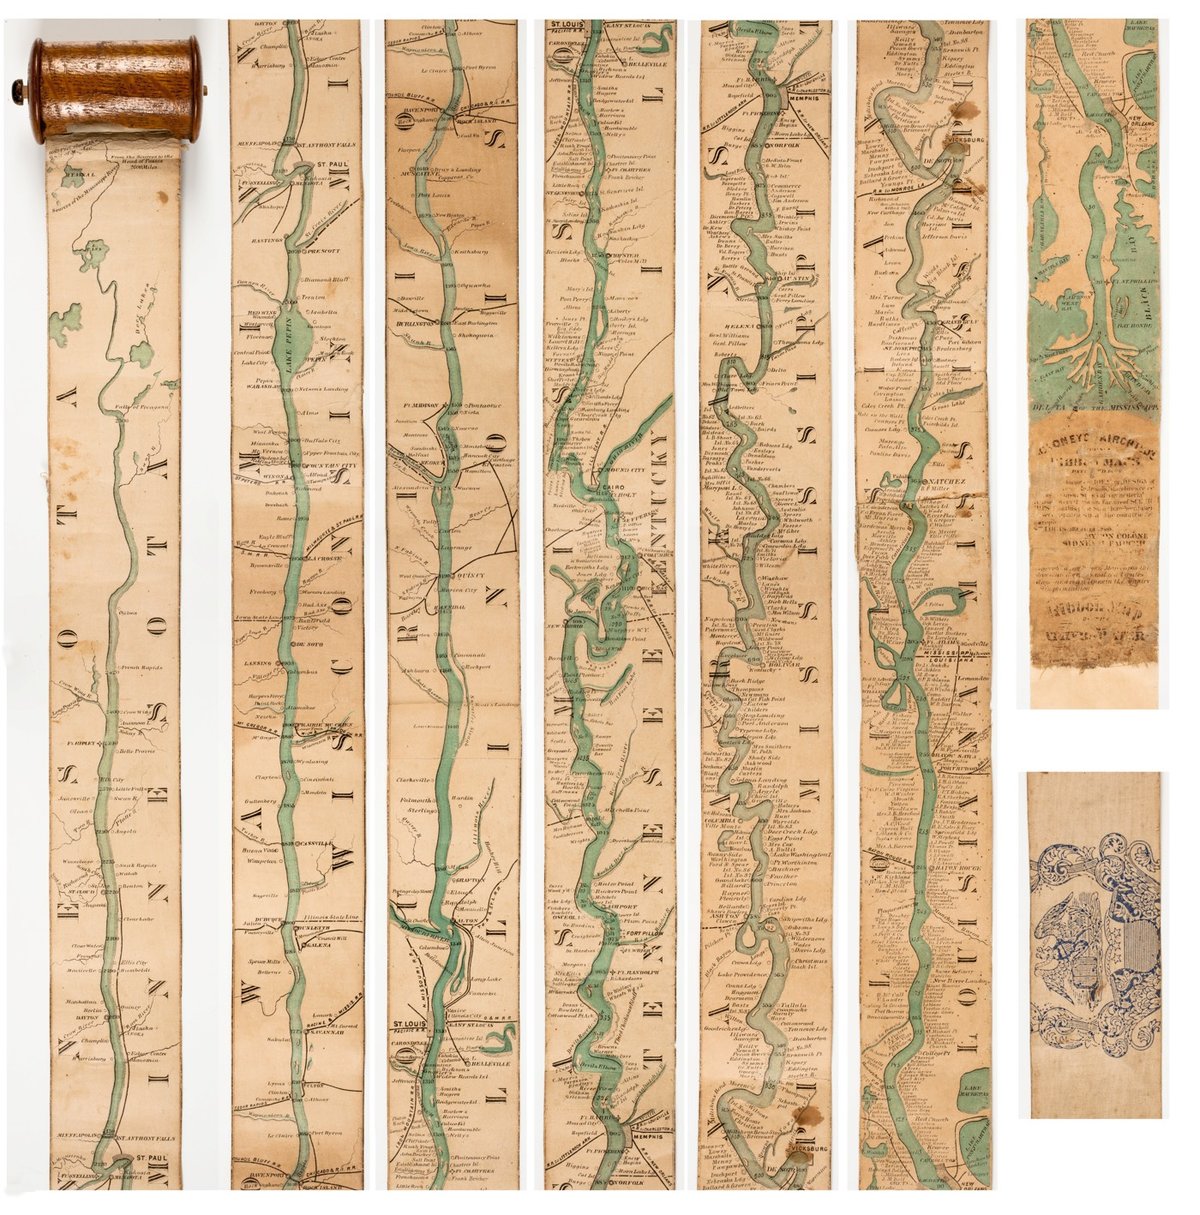
The Mississippi River runs for more than 2300 miles straight through the heartland of America, more or less straight from north to south. Representing the river in any detail presented a challenge for mapmakers wishing to provide maps to those wanting to travel along the river. In 1866, Coloney & Fairchild solved the problem by producing the Ribbon Map of the Father of Waters, a 2-inch wide & 11-foot long map that spooled up into a carrying case via a hand crank. From Nenette Luarca-Shoaf’s description of the map:
Coloney and Fairchild’s patented apparatus required that the single sheet be cut into strips, attached end-to-end, mounted on linen, and then rolled inside a wooden, metal, or paper spool (fig. 4). The resulting portability of the map was crucial because, as advertisements indicated, it was intended for business travelers, steamboat navigators, and tourists.
You can explore larger images of the ribbon map at the David Rumsey Map Collection or the American Antiquarian Society.
See also the meander maps of the Mississippi River. And I would love to see a satellite photo trip down the Mississippi like Best of Luck With the Wall, Josh Begley’s video journey along the 2000 miles of the US/Mexico border. (via open culture)
Update: In the 1840s, John Banvard painted a “moving panorama” of the Mississippi that measured 1300 feet in length. (via @mattbucher)
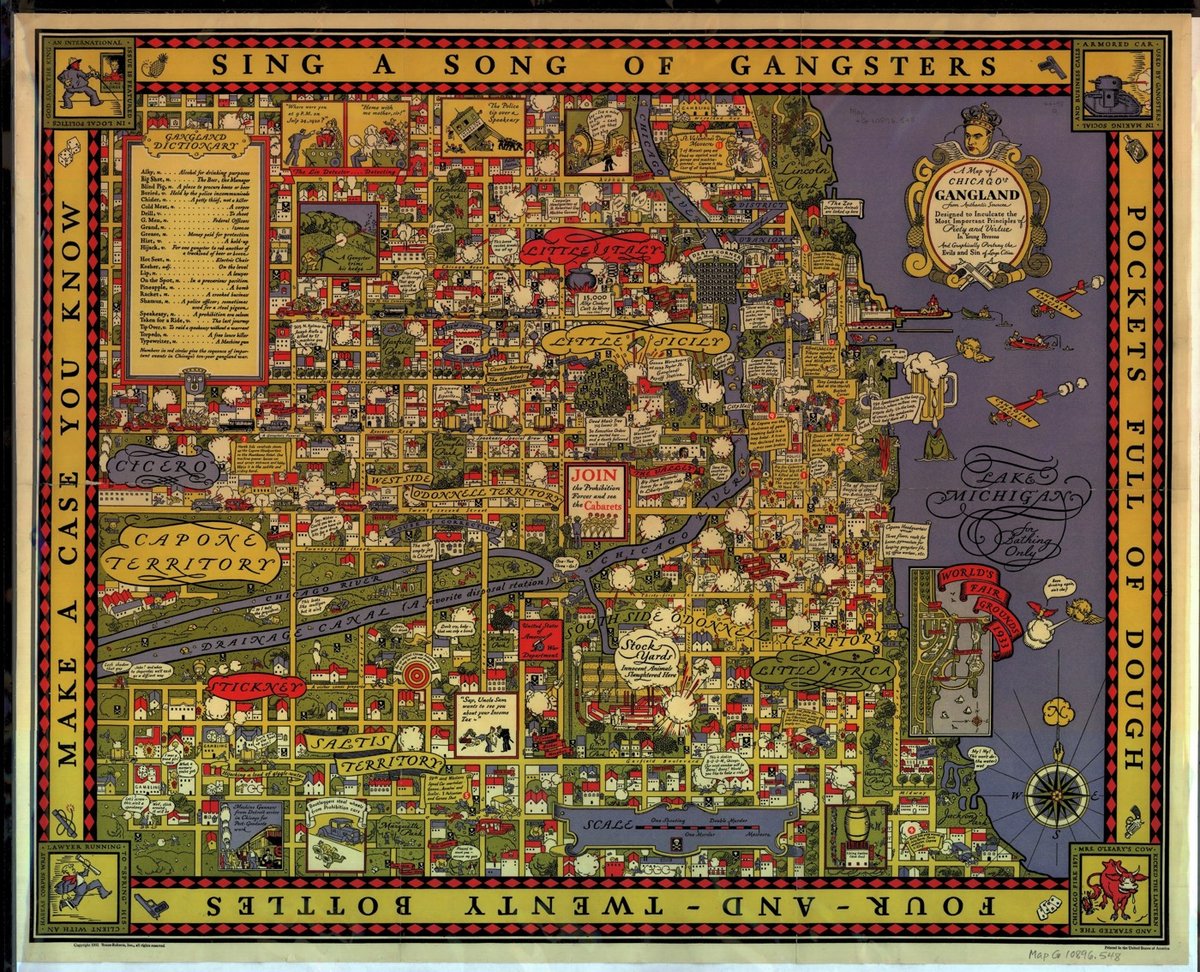
This is A Map of Chicago’s Gangland from Authentic Sources published in 1931 by Bruce-Roberts, Inc.
Map of Chicago gang locations showing Little Italy, Little Sicily, Cicero, Capone Territory, Westside O’Donnell Territory, Stickney, Saltis Territory, Southside O’Donnell Territory, and Little Africa. “Designed to inculcate the most important principles of piety and virtue in young persons, and graphically portray the evils and sin of large cities.” Numbers in red circles give the sequence of important events in Chicago’s gangland war. Insets include: Mrs. O’Leary’s cow, lawyer running to spring his client, an armored car, bootleggers stealing wheels from prohibition cars, machine gunners arriving from Detroit, World’s Fair grounds of 1933, police tipping over a speakeasy, and “gangland dictionary”.
Al Capone looms large over the map; he was arrested for tax evasion that year and sentenced to 11 years in federal prison. There’s also a zoomable reproduction you can explore at the David Rumsey Map Collection.
Update: See also these historic vice maps of Chicago depicting “all of the bars, dives, brothels, saloons, pool halls and gambling houses in the Levee and Little Cheyenne Districts of Chicago between 1870 and 1923”.
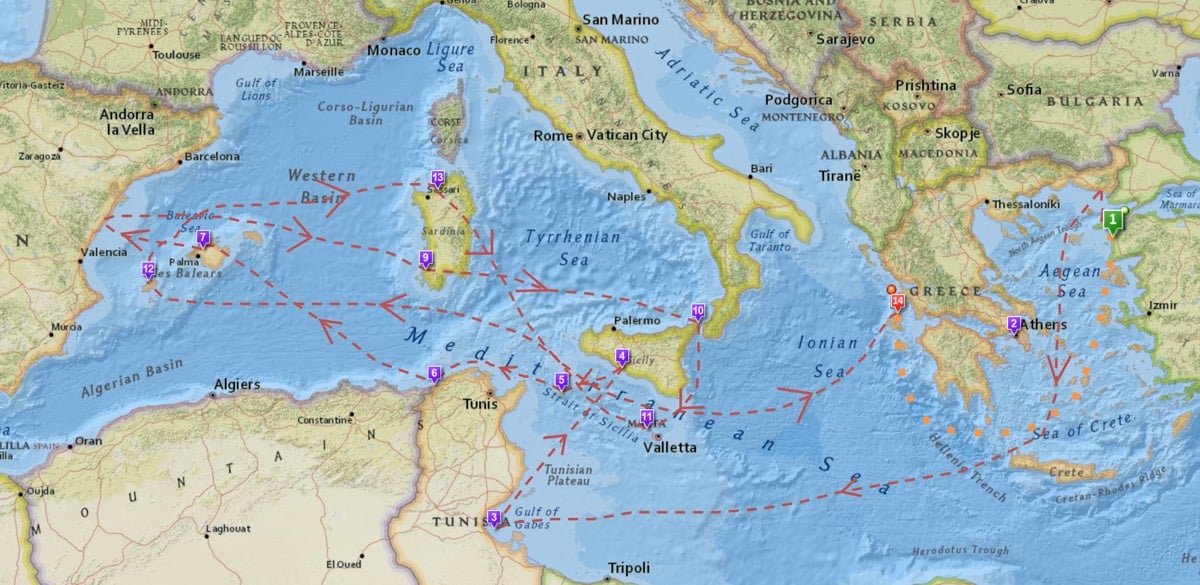
I’m currently reading Emily Wilson’s recent translation of The Odyssey, but until I looked at this map of Odysseus’ journey, I had little idea how scenic his route home was.1 The gods were hella pissed! All this time, I’d been imagining him pinballing around amongst the Greek islands in the Aegean Sea, but the gods and fates blew Odysseus and his men to all corners of the Mediterranean Sea: Italy, Africa, and even Ibiza in Spain. That dude was LOST. (via open culture)
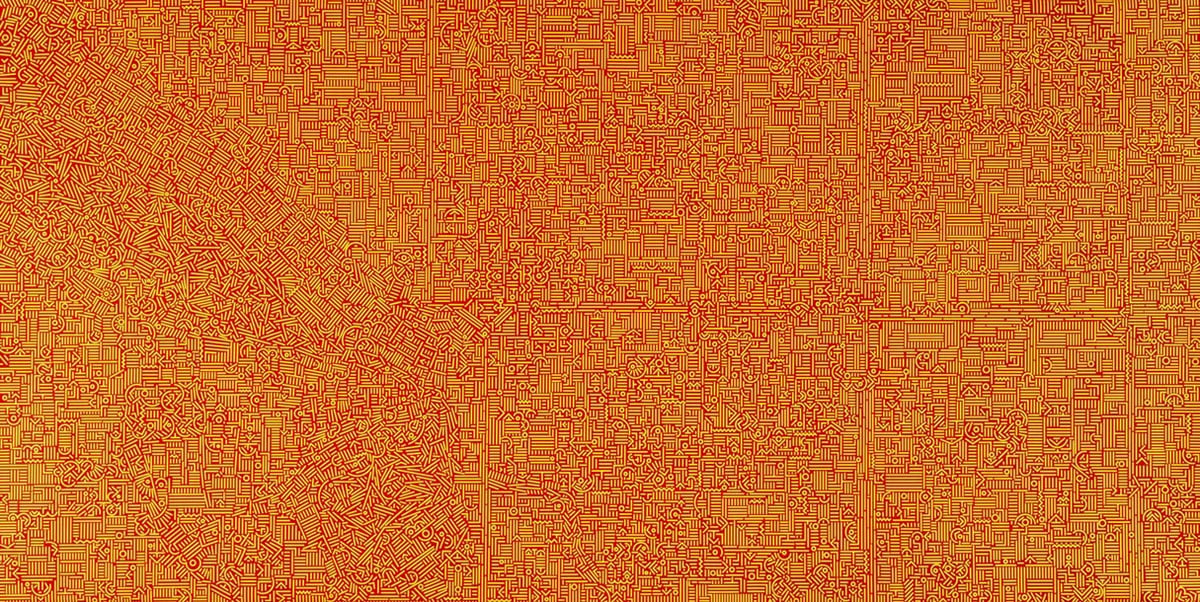
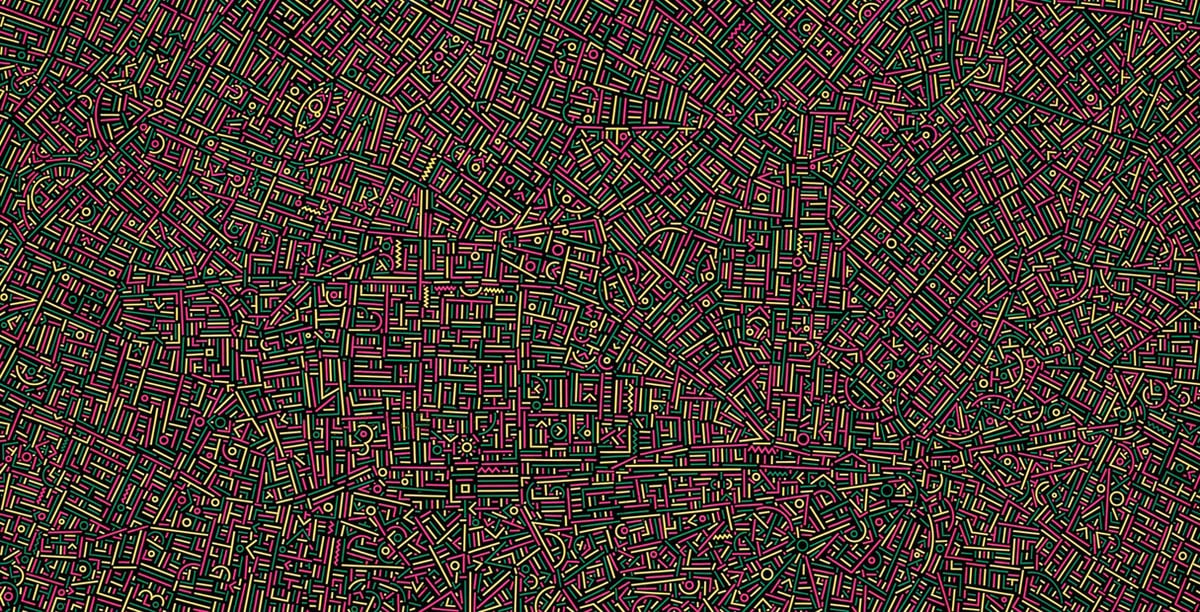
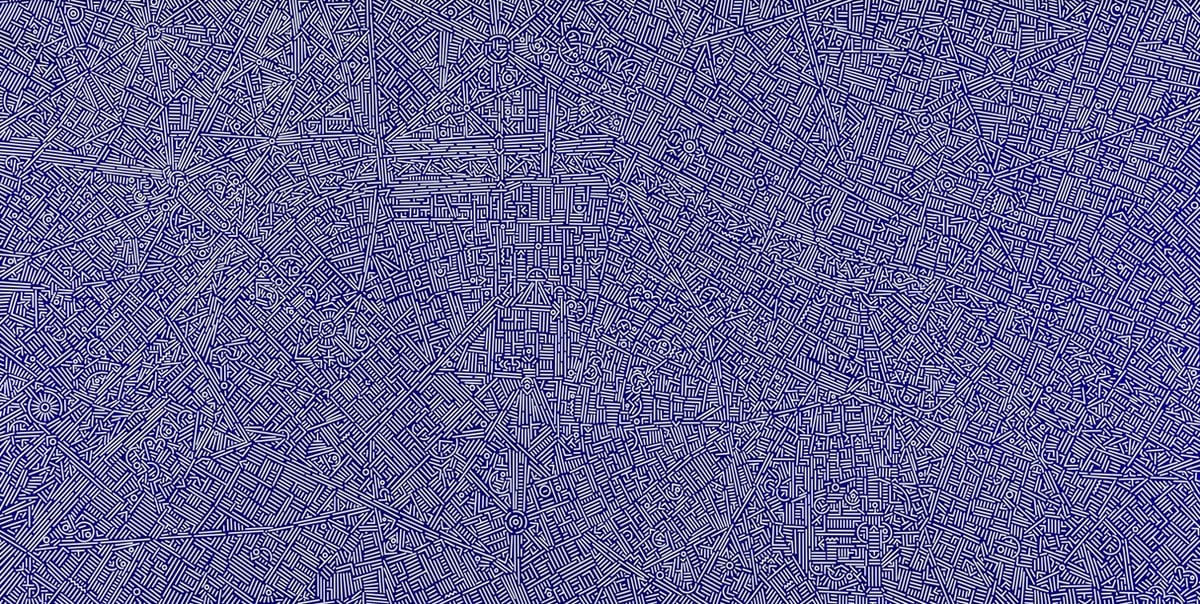
After Piet Mondrian moved to New York in 1940, his work became influenced by Manhattan’s grid system, particularly expressed in Broadway Boogie Woogie. Similarly, for his City DNA project, Xinjian Lu studied satellite maps of cities like Beijing, Athens, New York, and Los Angeles and then created these maze-like paintings that resemble the street layouts of each city. Mondrian++. Holy moly, I *love* these.
From top to bottom, Lu’s paintings depict Beijing, London, and Paris.
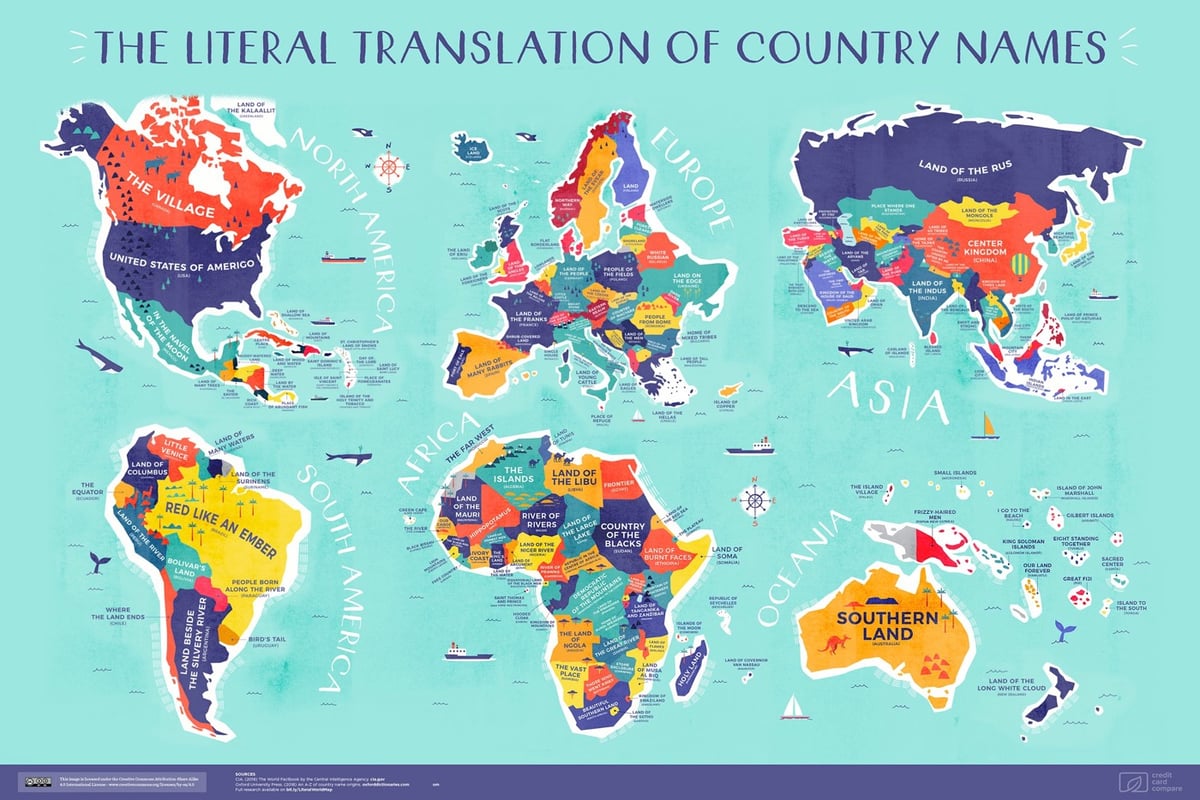
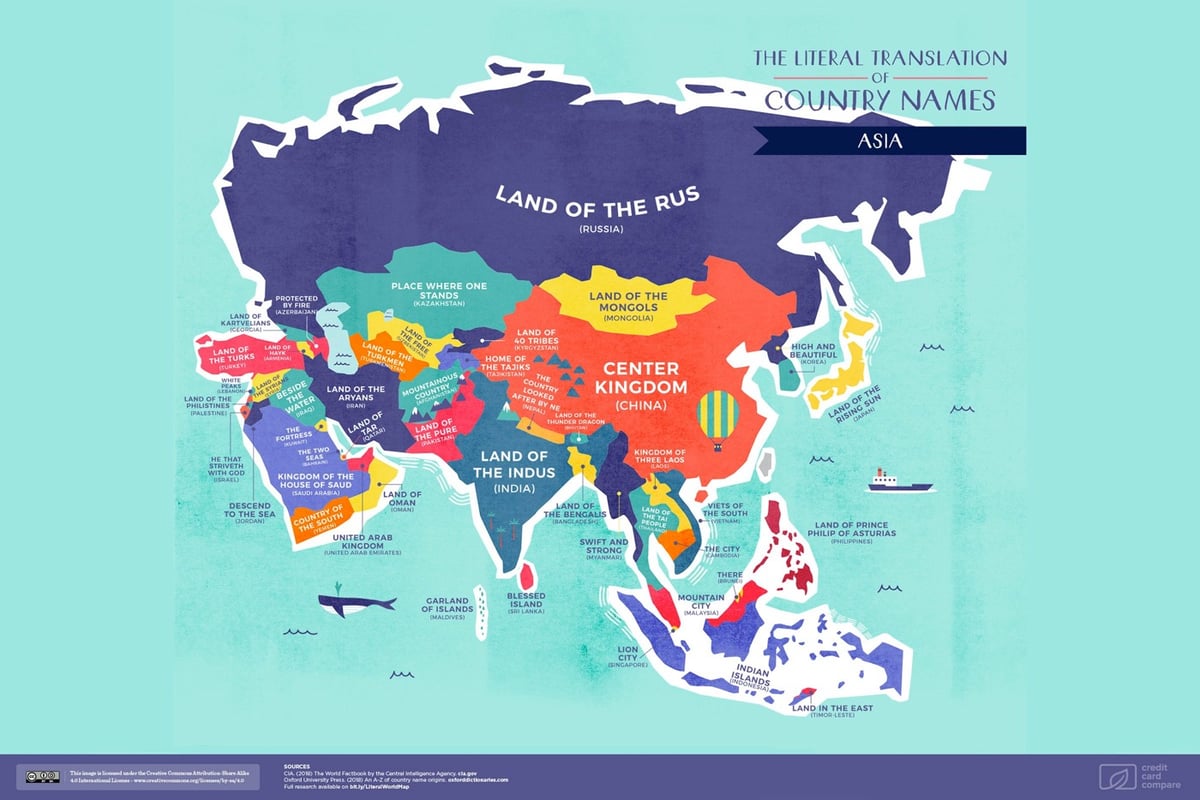
This is a map of the literal translations for the names of the world’s countries (bigger size). Some of the translations include:
Panama: Place of Abundant Fish
Paraguay: People Born Along the River
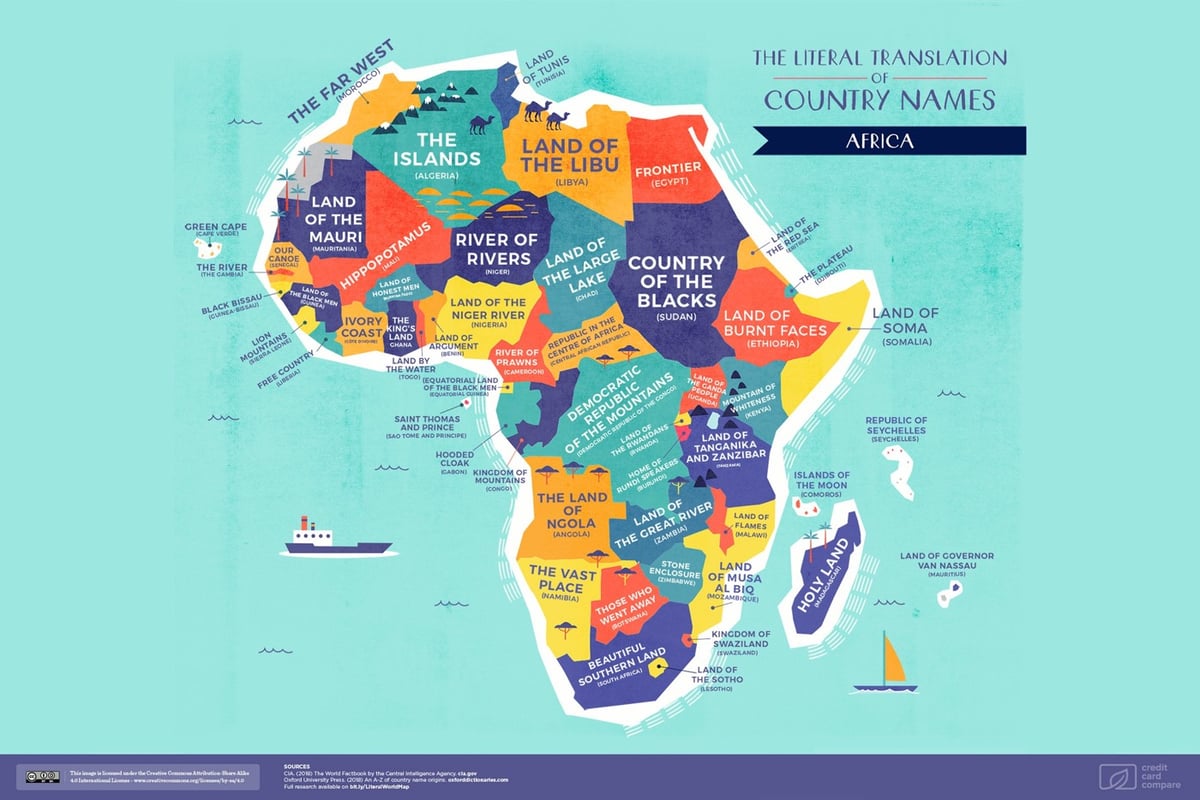
Namibia: The Vast Place
Ethiopia: Land of Burnt Faces
Egypt: Temple of the Soul of Ptah
Spain: Land of Many Rabbits
Hungary: 10 Arrows
Qatar: Land of Tar
Israel: He That Striveth with God
Thailand: Land of the Free
Nauru: I Go to the Beach
Australia: Southern Land
A spreadsheet of the translations and their sources is available here. See also a world map of every country’s tourism slogan. (via @danielhale)
Update: See also the Etymological Map of Africa. (via @danielhale)
Update: Two things. 1. This is not my map. I didn’t make it…it seems that (based on the logo in the lower right-hand corner) an Australian credit card comparison company did, but I can’t find any record of them having posted it anywhere online. 2. I have gotten many messages indicating the map is incorrect in one aspect or another, so you might want to take the whole thing with a healthy grain of salt (despite the research).
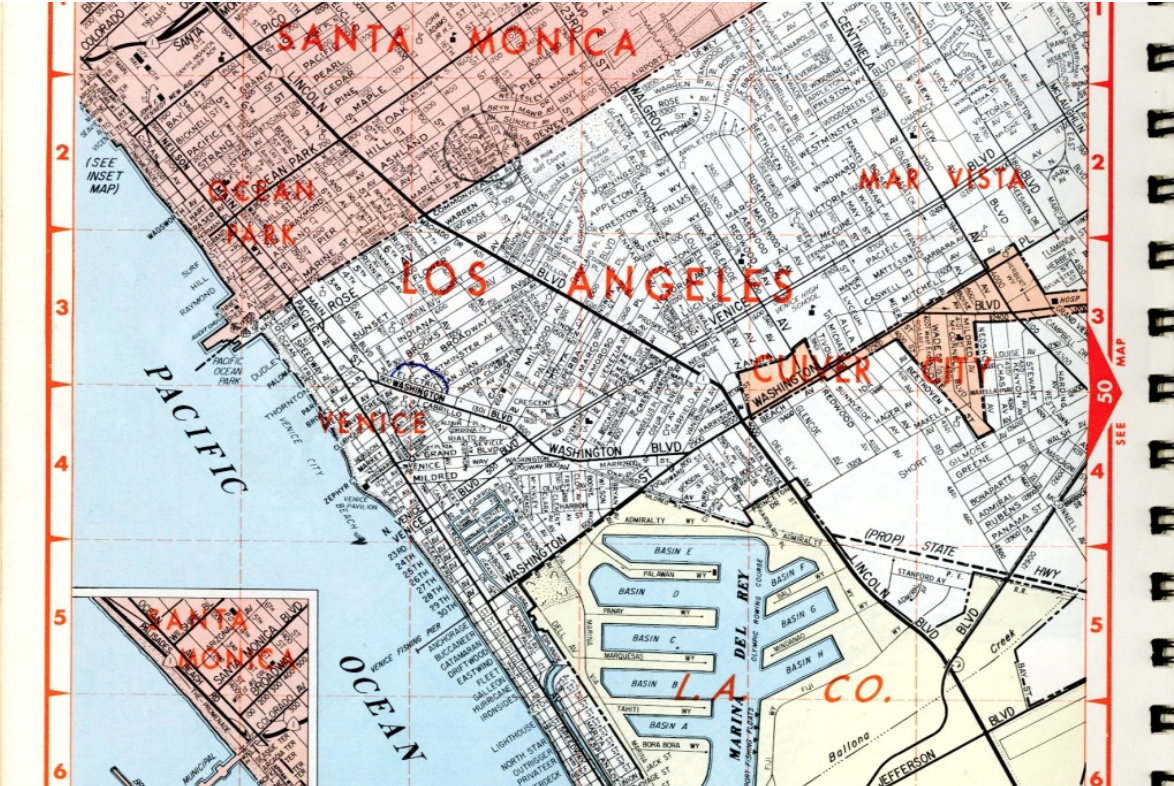
For anyone who loves maps, history, or the history of maps, Airtalk did a segment this week on the beloved Thomas Guide.
During the year I spent in LA in 2004, I have distinct memories of frantically flipping from page to page in the Thomas Guide as co-pilot. You had to memorize the page numbers of the areas you frequented because they were not always in order (a north/south jump would sometimes take you thirty pages off). After a few months of this, we had pages fall out of the spiral-bound guide that we were always shoving back in the book. It was really the only way to navigate the maze of sprawl here other than printing out turn-by-turn directions from Mapquest (which we also did).
This animation shows how humans have spread and organized themselves across the Earth over the past 200,000 years. The time lapse starts with the migration of homo sapiens out of sub-Saharan Africa 200,000 years ago, with a few thousand years passing every second. As the agricultural revolution gets underway and the pace of civilization quickens, the animation slows down to hundreds of years per second and eventually, as it nears modern times, 1-2 years per second.
See also time lapse animations of the history of Europe from the fall of Rome to modern times and human population through time. (via open culture)
Artur Grabowski spent much of 2017 comparing three mapping apps (Google Maps, Apple Maps, Waze) to see which one was the most accurate and resulted in the fastest route times. After 120 trips, the data showed that Google Maps got him to his destinations most quickly, Apple Maps made the most accurate predictions, and Waze promised the fastest times but often under-delivered.
So that’s some News You Can Use™ (assuming the results are statistically significant), but then Grabowski goes on to discuss why each app might over- or under-promise on route times based on the presence of advertising:
For Apple, Maps is a basic solution for its average user who wants a maps solution out of the box. Apple Maps does not directly drive ad or subscription revenue for Apple so there is less reason for Apple to incentivize iOS users to use Apple Maps over other solutions. However, Apple does care about user experience, and sandbagging trip time estimates so that users arrive at their destination on time results in a great user experience. Hence, I believe that Apple is intentionally conservative with estimated arrival times.
At the other extreme, Waze (Alphabet) makes money through ads when you use their app. What better way to get people to use your navigation app than by over-promising short trip times when no one takes the time to record data and realize that you under-deliver? If an unsuspecting user opens Apple Maps and sees a 34-minute route and compares that to 30-minutes in Waze, the deed is done. Now Waze has a life-long customer who doesn’t realize they’ve been hoodwinked and Waze can throw at them stupidly annoying ads.
If that’s happening with your mapping app, just think of how your search results, Facebook newsfeed, and Instagram feed are manipulated to be more amenable to advertising. Oh, and don’t forget about almost everything you watch and read. Even Black Panther and Get Out had paid product placements. I wonder how many more car chases there are in action movies due to deep pockets at Acura or Mercedes or BMW. (via df)
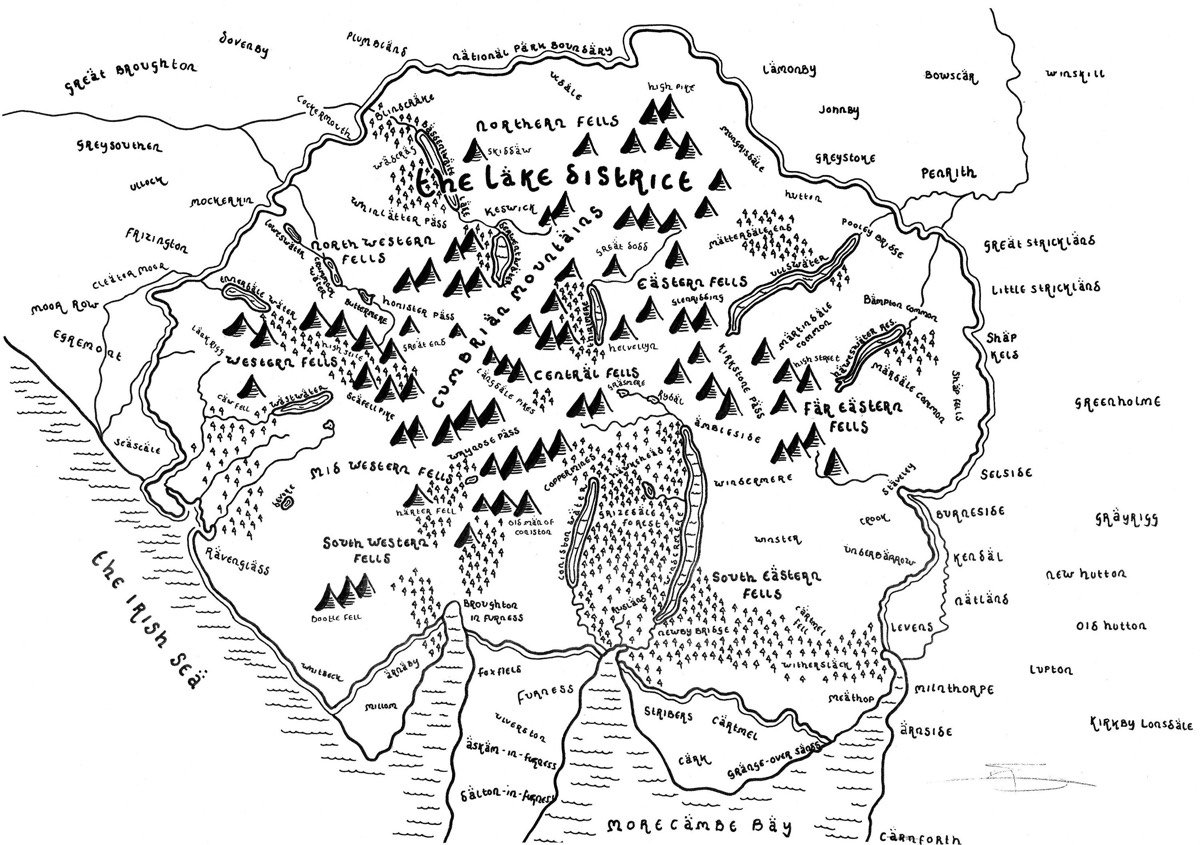
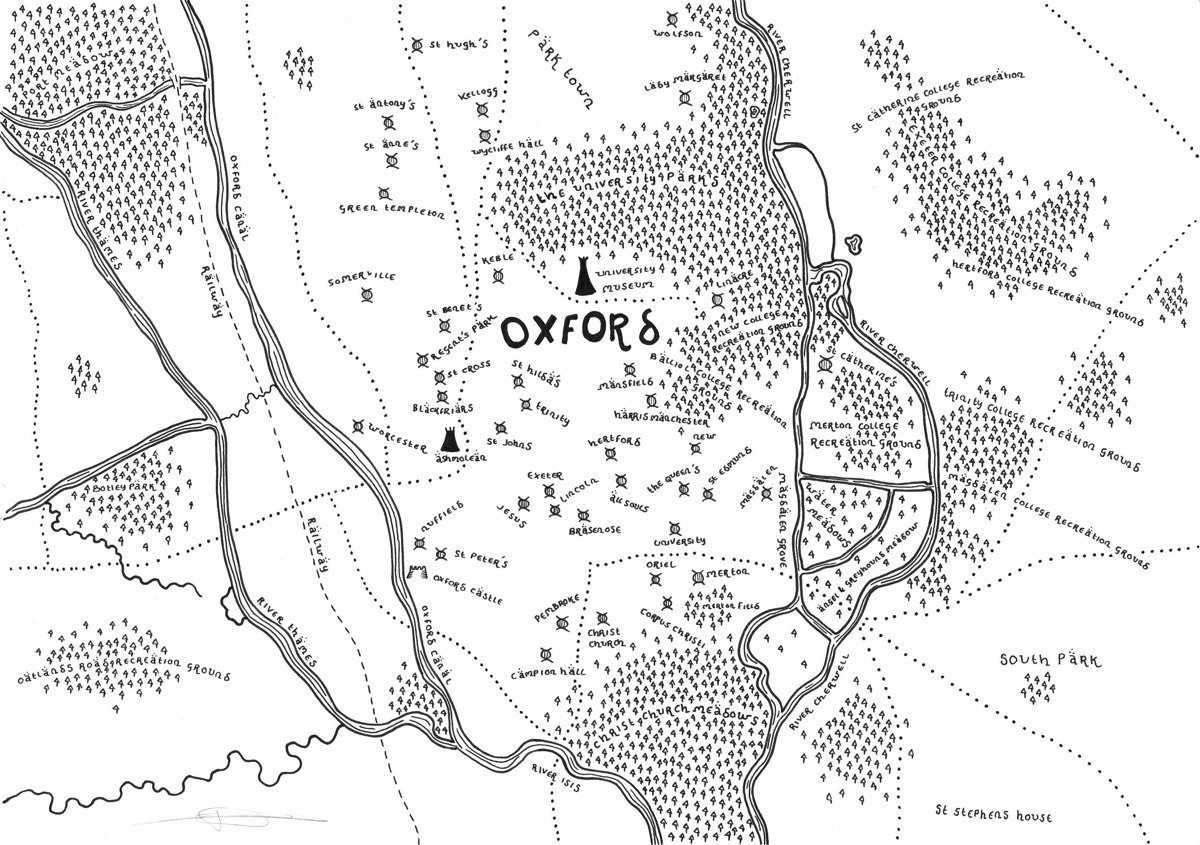
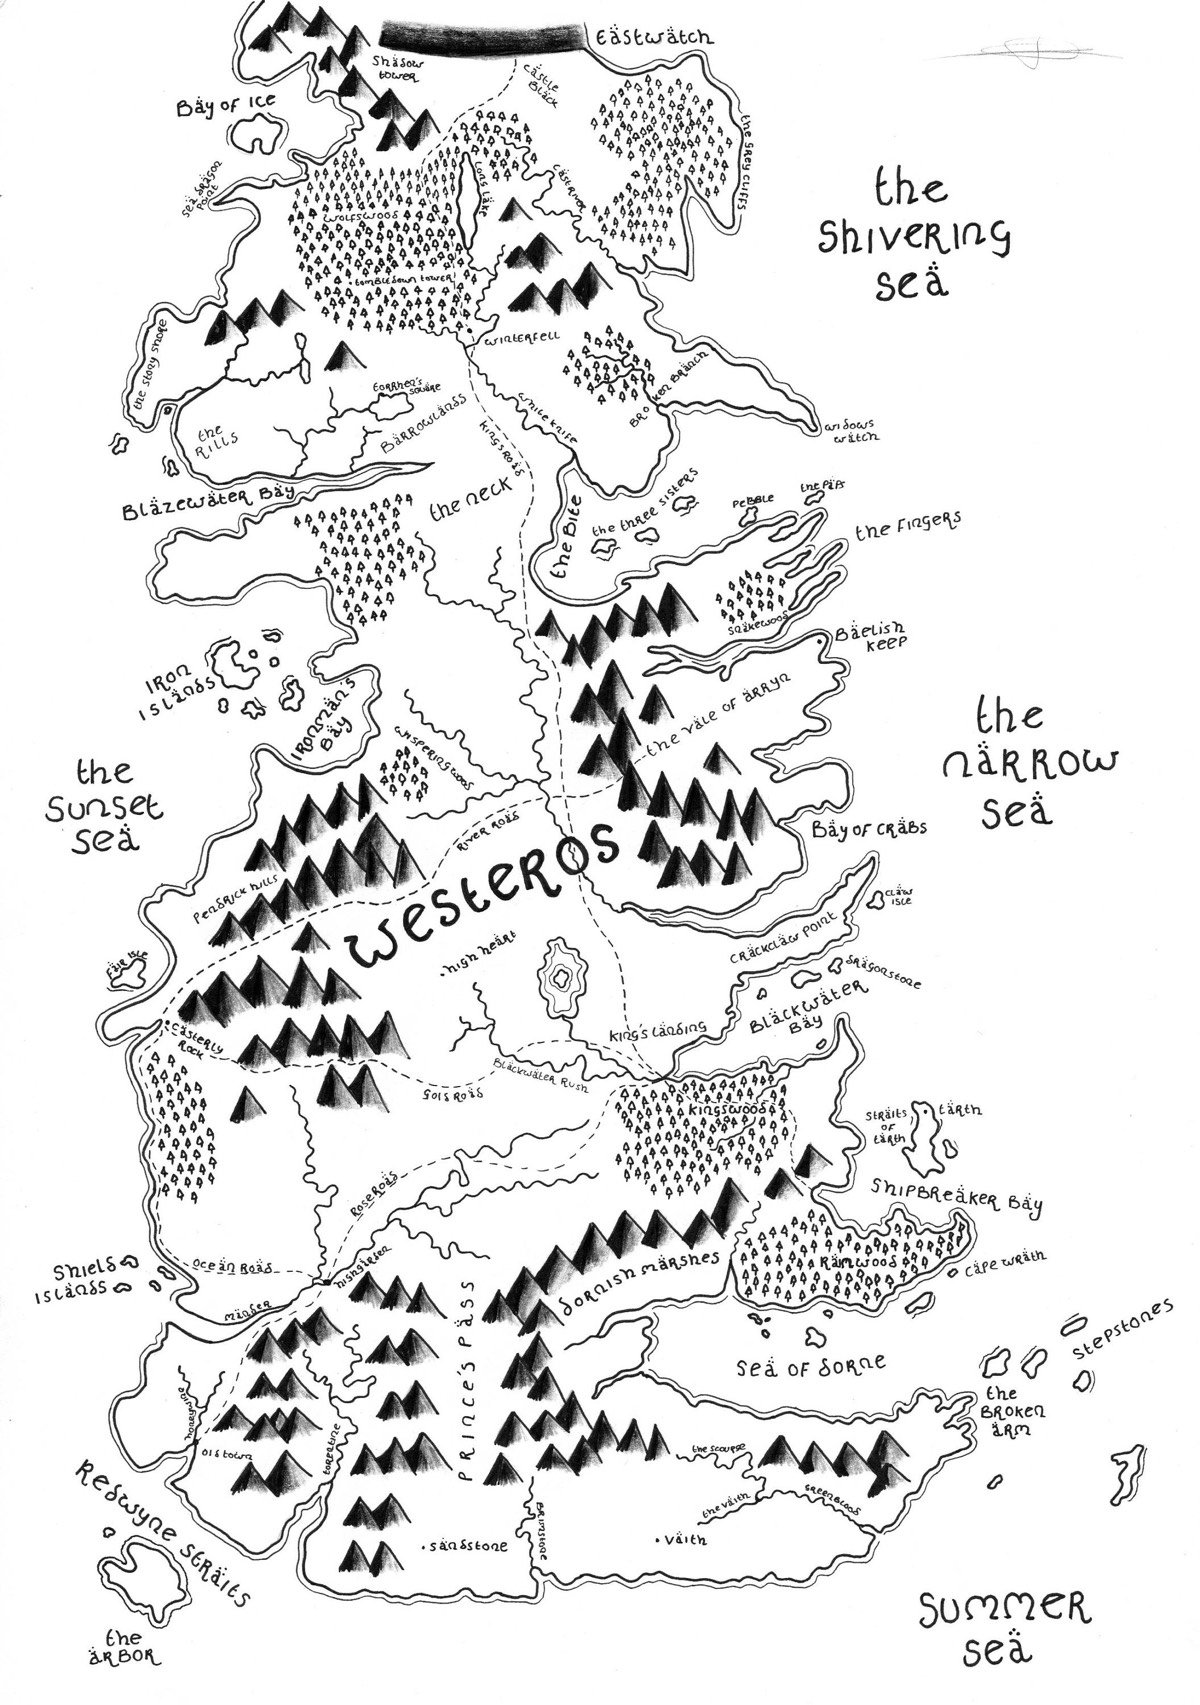
Artist Dan Bell has drawn maps of the UK’s national parks in the style of J.R.R. Tolkien’s Middle-Earth. Bell has also drawn maps of Westeros (from George R.R. Martin’s Game of Thrones series) and places like London and Oxford. Both prints and the original hand-drawn maps are available for purchase from Bell’s online shop.
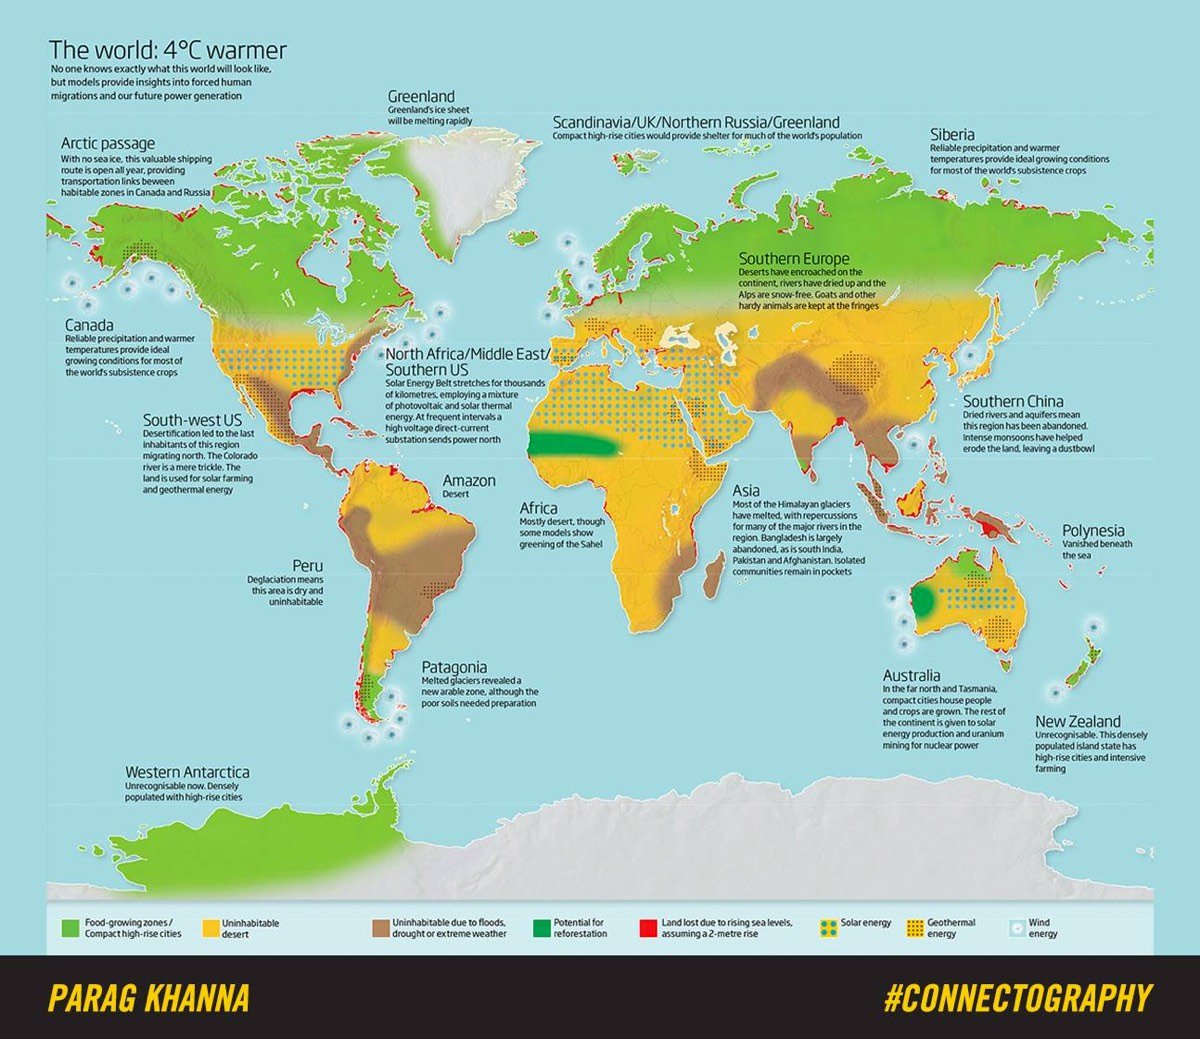
In this speculative world map published in 2009, New Scientist imagines what the world might look like if (or more likely, when) the Earth warms by 4ºC. Many current coastal areas would be underwater and much of the most heavily populated areas of the Earth would be desert or otherwise uninhabitable while the northern parts of Canada and Russia would become the new bread baskets of the world. But on the plus side, western Antartica would be habitable and possibly “densely populated with high rise cities”. In an article that accompanied the map, Gaia Vince wrote:
Imagine, for the purposes of this thought experiment, that we have 9 billion people to save — 2 billion more than live on the planet today. A wholesale relocation of the world’s population according to the geography of resources means abandoning huge tracts of the globe and moving people to where the water is. Most climate models agree that the far north and south of the planet will see an increase in precipitation. In the northern hemisphere this includes Canada, Siberia, Scandinavia and newly ice-free parts of Greenland; in the southern hemisphere, Patagonia, Tasmania and the far north of Australia, New Zealand and perhaps newly ice-free parts of the western Antarctic coast.
The citizens of the world’s wealthiest and most populous nations will become climate refugees, which means things are going to get really, really ugly for everyone else.
In 1990, China, Hong Kong, and Taiwan had only a handful of subway lines. In the early 2000s, growth in the number of cities with subways started to increase dramatically, as did the number of lines in the bigger cities like Beijing and Shanghai. As of 2020, more than 40 Chinese cities will have subway systems. Check out this time lapse map by “transit nerd” Peter Dovak (who also did these Mini Metros maps):
In this time, Beijing and Shanghai in particular have ballooned from nearly nothing into the world’s two largest, in both length and annual ridership. The timeline of their expansion alone is mesmerizing.
Meanwhile, the NYC subway system is…
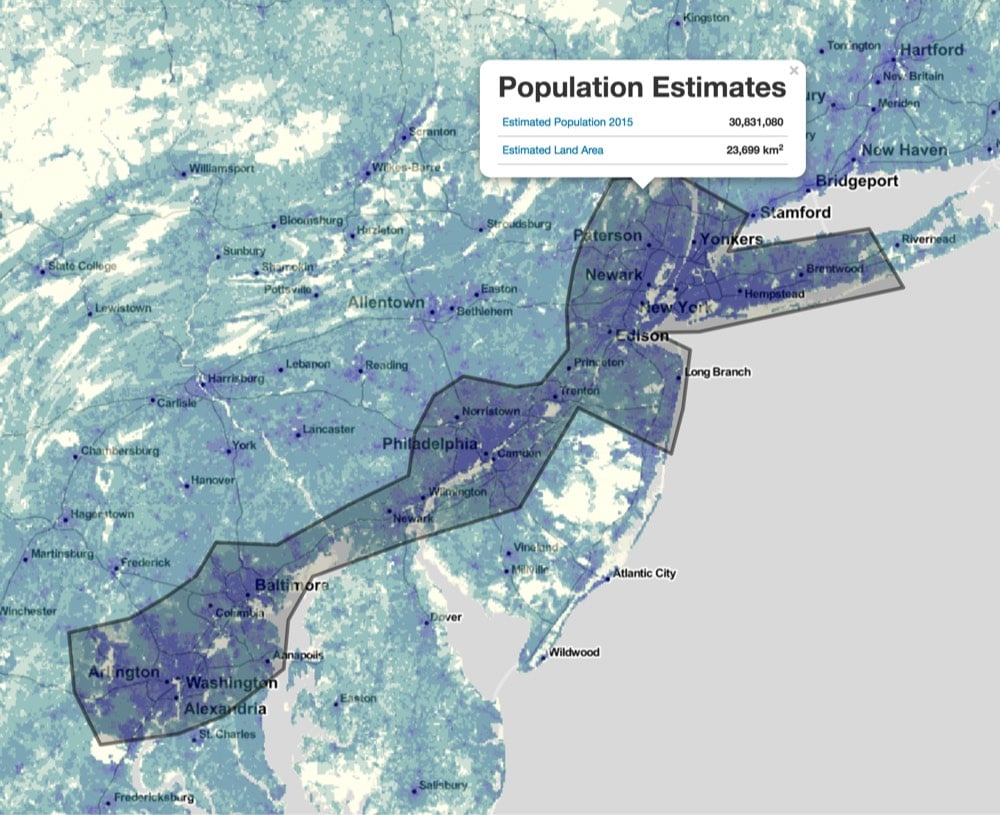
NASA has built a service for estimating populations, part of which is a map hosted by Columbia on which you can draw a circle or a shape and the map will give you an estimate of the population contained by the shape. You can also access the service via an API…just send it polygonal coordinates and it returns population data.
Just for fun, I drew a small circle with an area of ~7000 sq. km and dragged it around to different spots on the globe:
NYC: 15,251,980
Rural Wyoming: 31
London: 12,972,590
Lagos, Nigeria: 14,106,980
Mumbai: 24,513,630
Tibet: 2,226
Seoul: 23,439,930
Tokyo: 32,572,740
Mexico City: 21,319,990
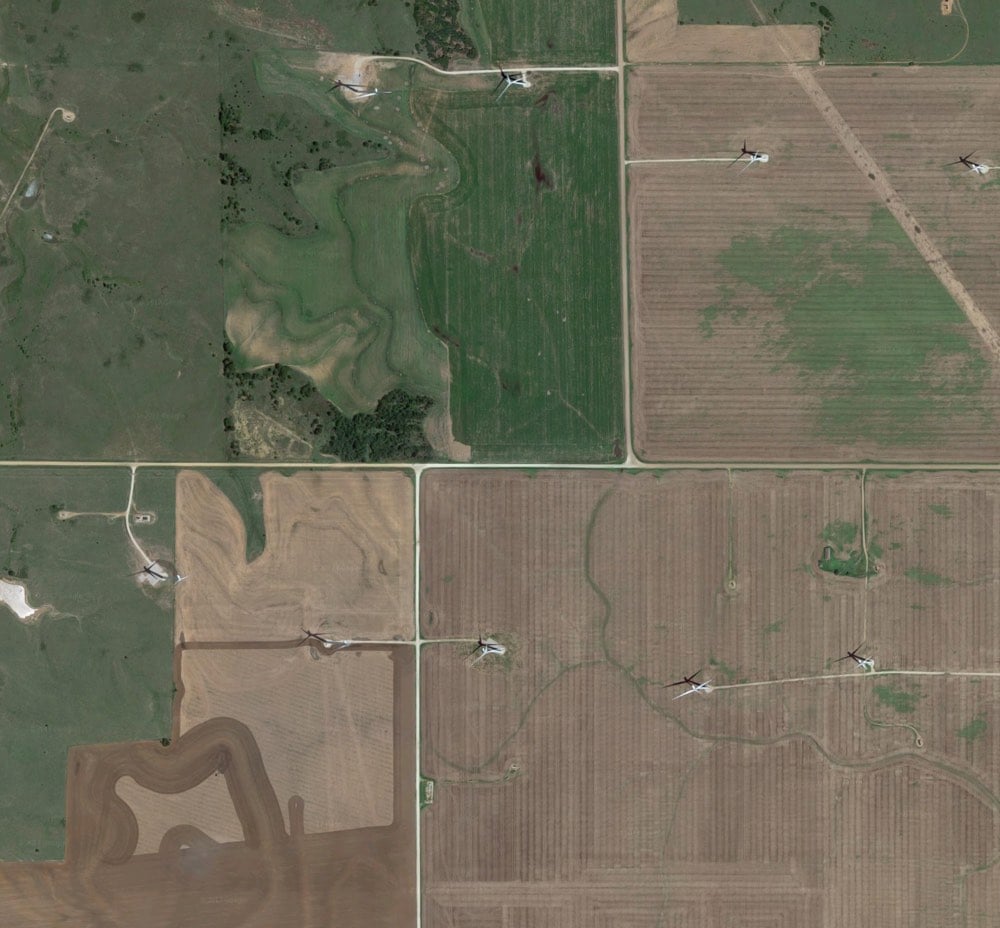
Have you ever wondered why, when you’re driving along on a straight road in the Western US, there’s a weird curve or short zigzag turn thrown into the mix? Grids have been used to lay out American roads and houses since before there was a United States. One of the most prominent uses of the grid was in the Western US: the so-called Jefferson Grid.
The Land Ordinance of 1785, drafted by Thomas Jefferson, extended government authority over the Mississippi River and the Great Lakes regions. As a response to what he believed to be a confusing survey system already in use, Jefferson suggested a new grid system based on the rectangle. The grid divided land into plots one mile square, each consisting of 640 acres. The grid also placed a visible design upon a relatively untouched landscape.
As most people know, the Earth is roughly spherical. When you try to cover the surface of a sphere with squares, they are not going to line up perfectly. That means, every so often, sections of the grid shift away from each other. Gerco de Ruijter’s short film, Grid Corrections, shows dozens of examples of places where this shift occurs and the corrections employed to correct them.
By superimposing a rectangular grid on the earth surface, a grid built from exact square miles, the spherical deviations have to be fixed. After all, the grid has only two dimensions. The north-south boundaries in the grid are on the lines of longitude, which converge to the north. The roads that follow these boundaries must dogleg every twenty-four miles to counter the diminishing distances.
If you want to look at some of the corrections yourself, try this location in Kansas (or this one). See that bend? Now scroll the map left and right and you’ll see a bunch of the north/south roads bending at that same latitude.
You can read more about de Ruijter’s project and grid corrections in this Travel & Leisure article by Geoff Manaugh.
Update: An email from my dad:
Hi son, just reading your blog on the section lines….don’t forget, you used to live on a correction line…that is why 3 of my 40’s were only 26.3 acres….
“40’s” refers to 40 acre plots…a common size for a parcel of land back when that area was divvied up. Wisconsin has so many lakes, rivers, and glacial features that interrupt the grid that it’s difficult to tell where the corrections are, but looking at the map, I can see a few roads curving at that latitude. Cool!
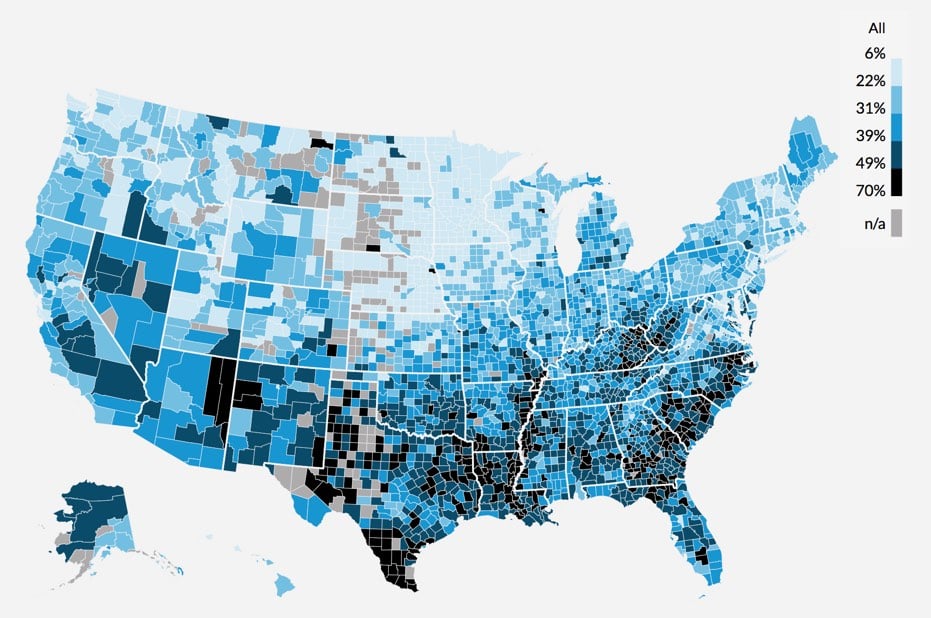
The Urban Institute has built an interactive map for exploring debt in America.
Credit can be a lifeline during emergencies and a bridge to education and homeownership. But debt-which can stem from credit or unpaid bills-often burdens families and communities and exacerbates wealth inequality. This map shows the geography of debt in America at the national, state, and county levels.
I’d love to hear why the “share with any debt in collections” is so relatively low in the Upper Midwest, Minnesota in particular.
Update: Unsurprisingly, health insurance coverage is a significant factor in American debt…and Minnesota has a low rate of medical debt in collections along with a relatively low rate of uninsured. This 2016 press release from MN Department of Health provides some clues as to why the uninsured rate is so comparatively low. (via @yodaui)

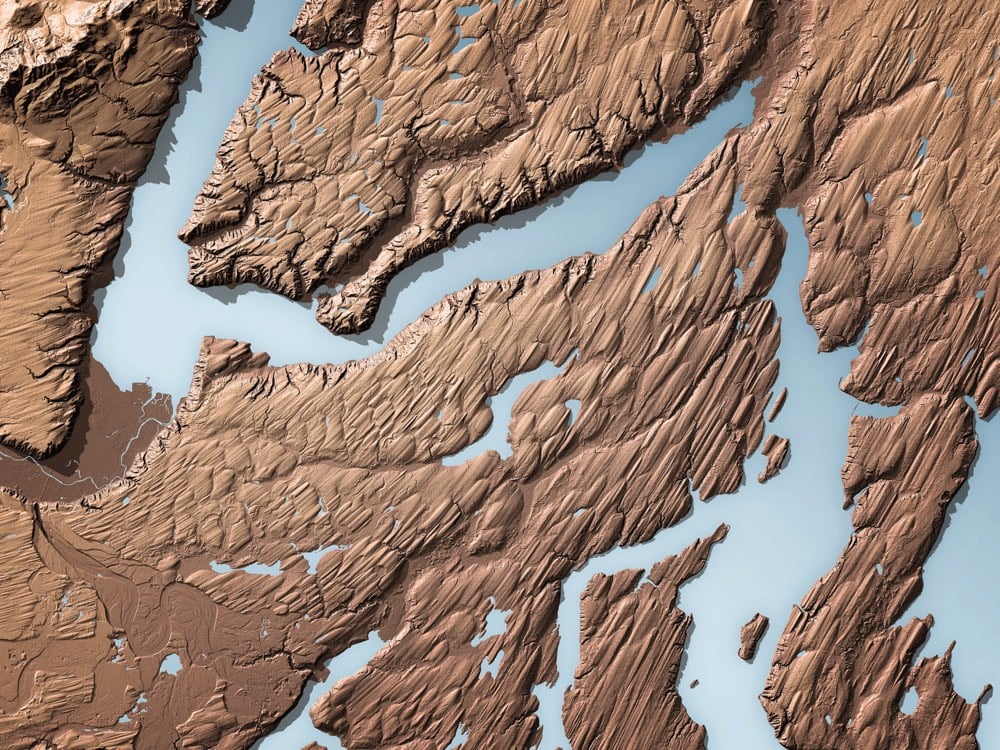
The Washington State Geological Survey is using LIDAR technology to study the geology of the land hidden under forested areas of the state. LIDAR is like radar, but instead of bouncing radio waves off of objects to detect their distances, you use lasers. When you shoot laser light at a forested area, most of it is reflected back by the trees. But some of it reaches the ground, so by measuring the light that’s reflected back from the lowest point, you get a very accurate map of the bare earth, sans nature. Using the LIDAR maps, they can study the course changes in rivers, landslides, volcanic lava flows, earthquake faults & fault zones, tsunami inundation zones, and glaciers.
The beautiful photo at the top is a LIDAR image of the Sauk River and all its current and former channels…the bluish tint makes it look like an x-ray, which it pretty much is. It also reminds me of the meander maps of the Mississippi River made by Harold Fisk for the US Army Corps of Engineers.
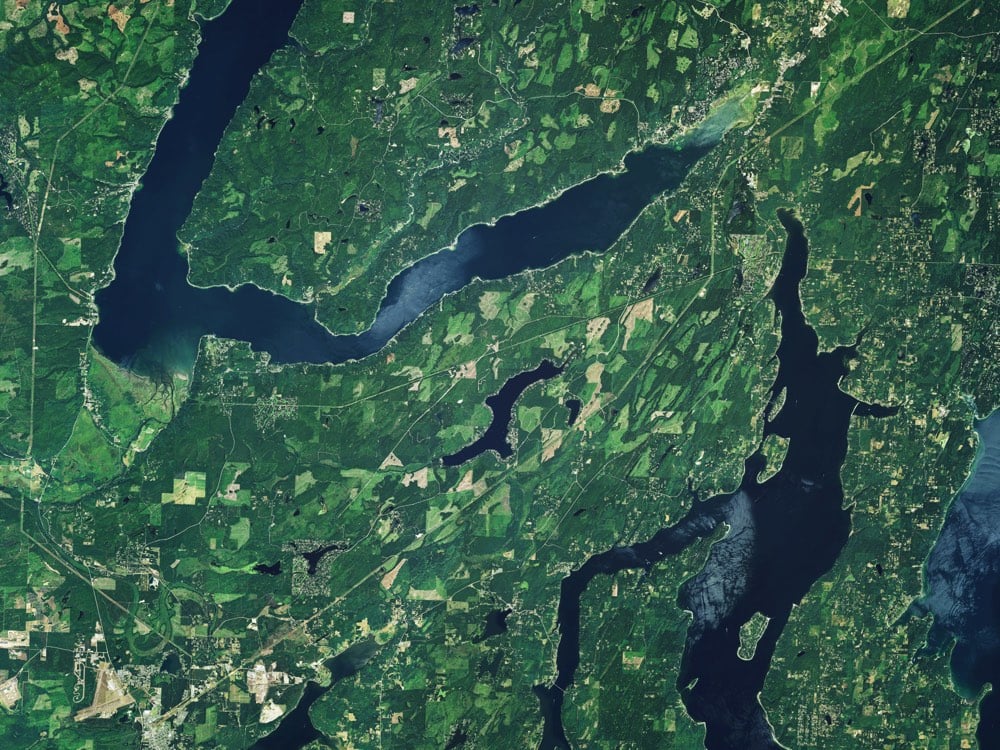
Here are two images of Bainbridge Island:
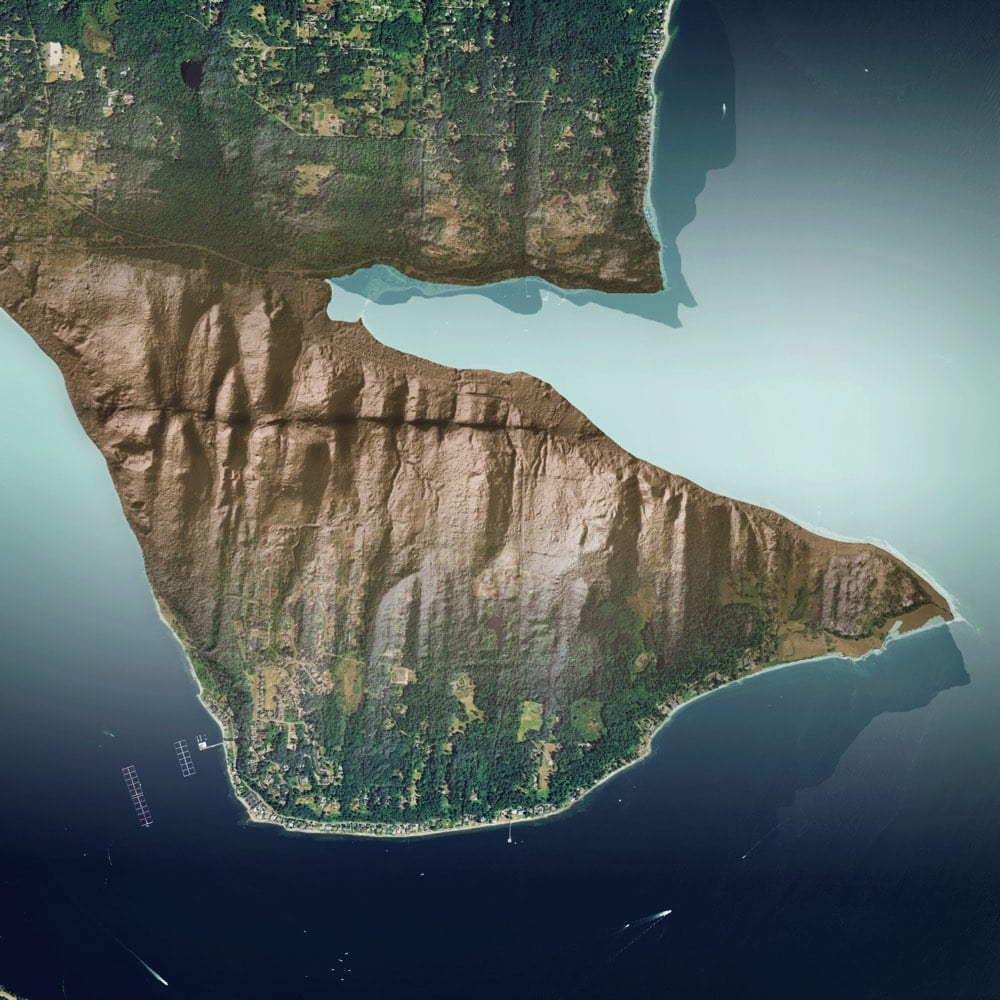
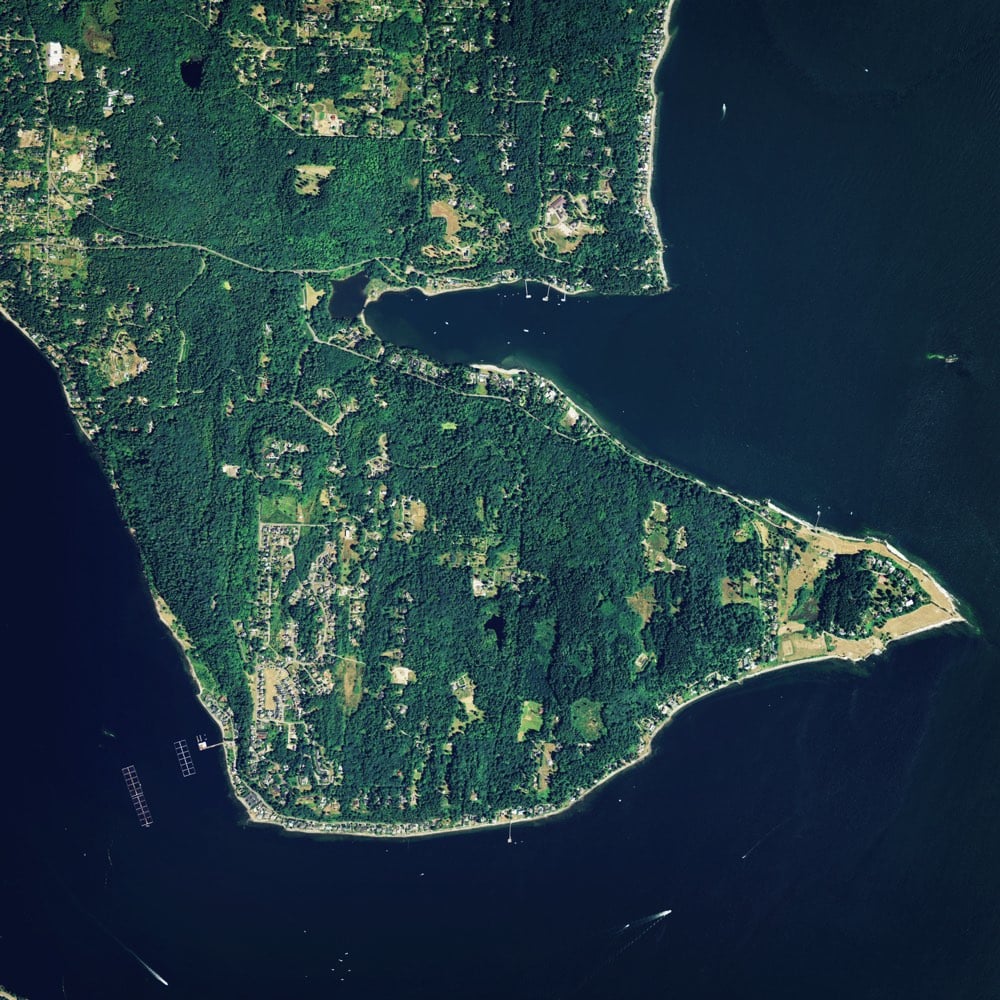
The LIDAR image clearly shows a horizontal earthquake fault scarp that’s completely hidden by the ground cover.
These two images are of drumlins left behind by a glacier:
Again, the LIDAR image shows the movement of a long-gone glacier with stunning clarity compared to the satellite photo with ground cover.
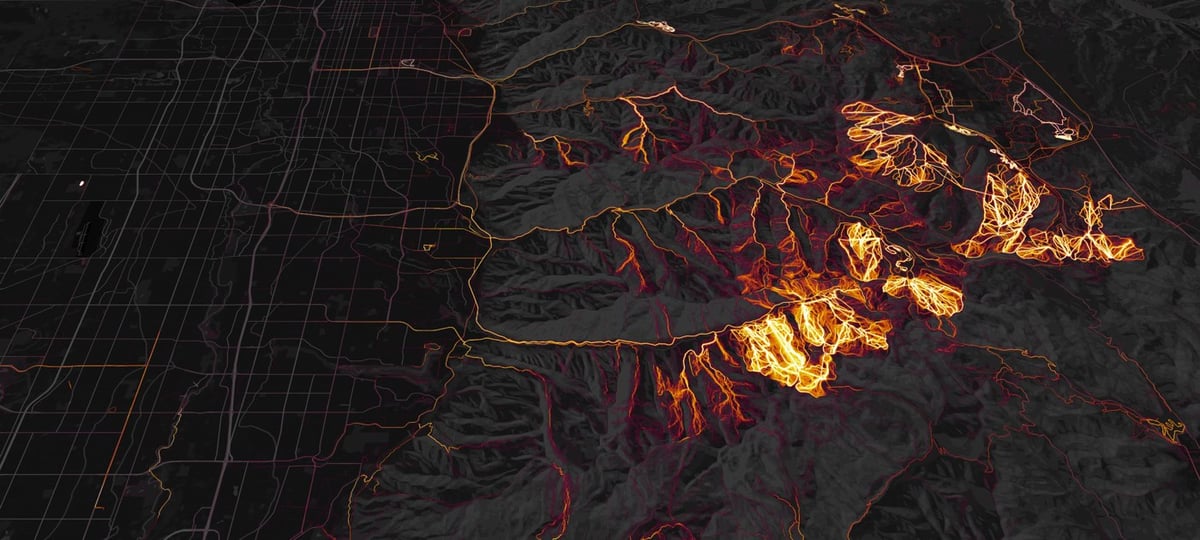
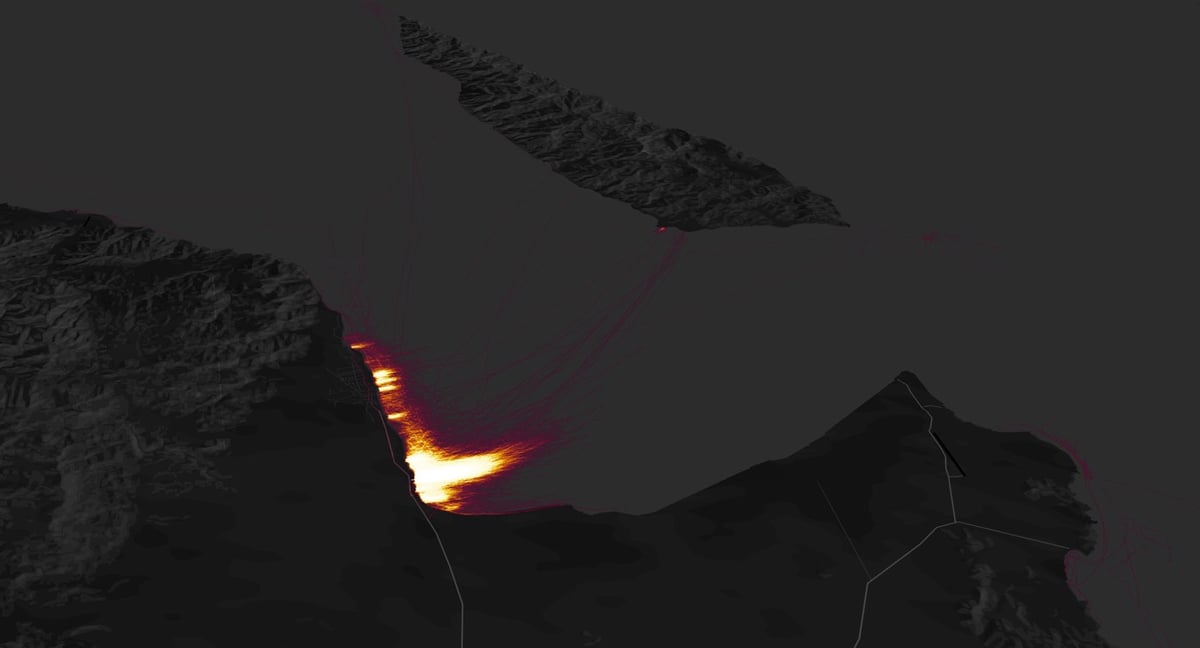
Strava, makers of apps that allow people to track and share their athletic activities, have released a global heatmap, a visualization of the humanity’s collective athletic activities. In a recent blog post, the company highlighted some of the most interesting spots on the map, which was created using 27 billion miles of data representing over 200,000 years of hiking, biking, running, skiing, and other sporting activity. Pictured above are the ski areas near Salt Lake City and kiteboarding in Baja, Mexico.
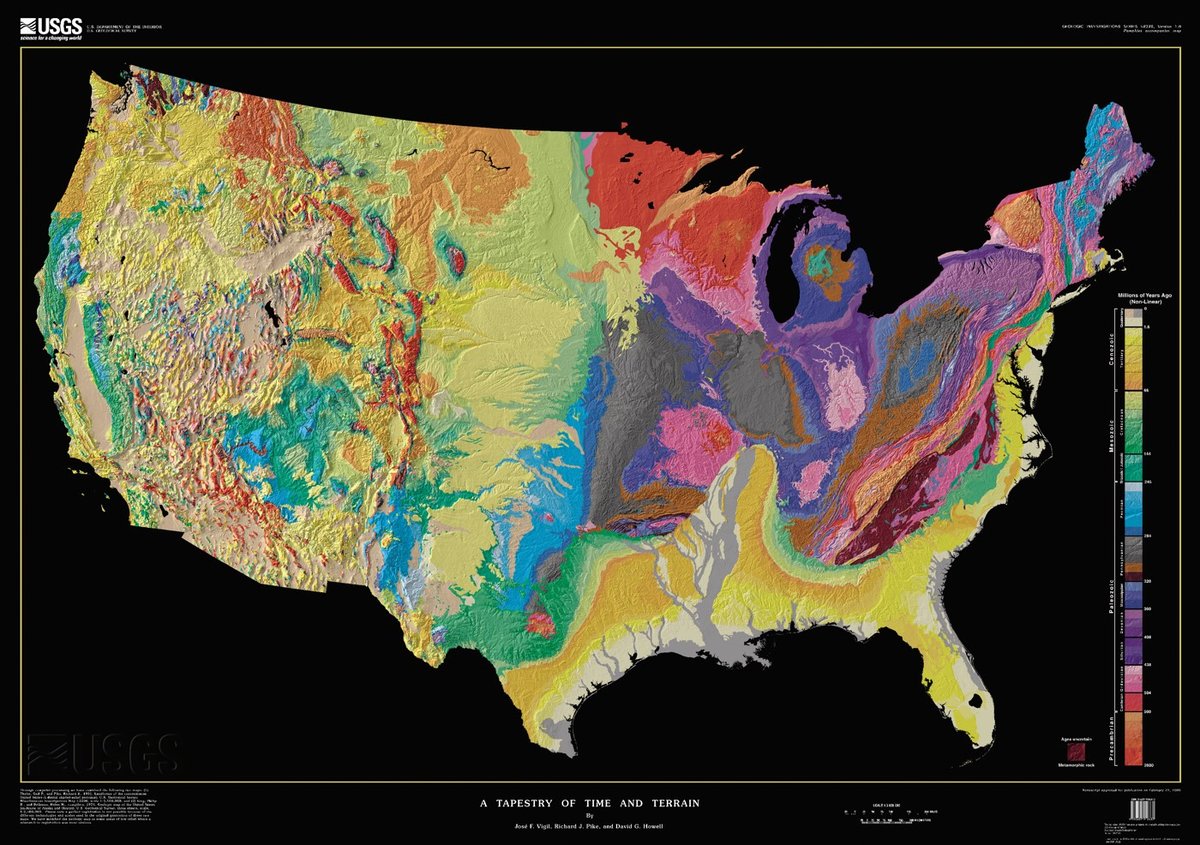
A Tapestry of Time and Terrain is a map from the USGS that shows the topology and ages of rock underneath the surface of the United States. The age scale on the right is difficult to read unless you download the full 45Mb PDF version, but it goes from Precambrian (2.6 billion years ago) at the bottom to more-or-less the present day at the top.
Through computer processing and enhancement, we have brought together two existing images of the lower 48 states of the United States (U.S.) into a single digital tapestry. Woven into the fabric of this new map are data from previous U.S. Geological Survey (USGS) maps that depict the topography and geology of the United States in separate formats. The resulting composite is the most detailed and accurate portrait of the U.S. land surface and the ages of its underlying rock formations yet displayed in the same image. The new map resembles traditional 3-D perspective drawings of landscapes with the addition of a fourth dimension, geologic time, which is shown in color. This union of topographic texture with the patterns defined by units of geologic time creates a visual synthesis that has escaped most prior attempts to combine shaded relief with a second characteristic shown by color, commonly height above sea level (already implicit in the shaded relief). In mutually enhancing the landscape and its underlying temporal structure, this digital tapestry outlines the geologic story of continental collision and break-up, mountain-building, river erosion and deposition, ice-cap glaciation, volcanism, and other events and processes that have shaped the region over the last 2.6 billion years.
(via @robgmacfarlane)
Newer posts
Older posts
Socials & More