kottke.org posts about geology
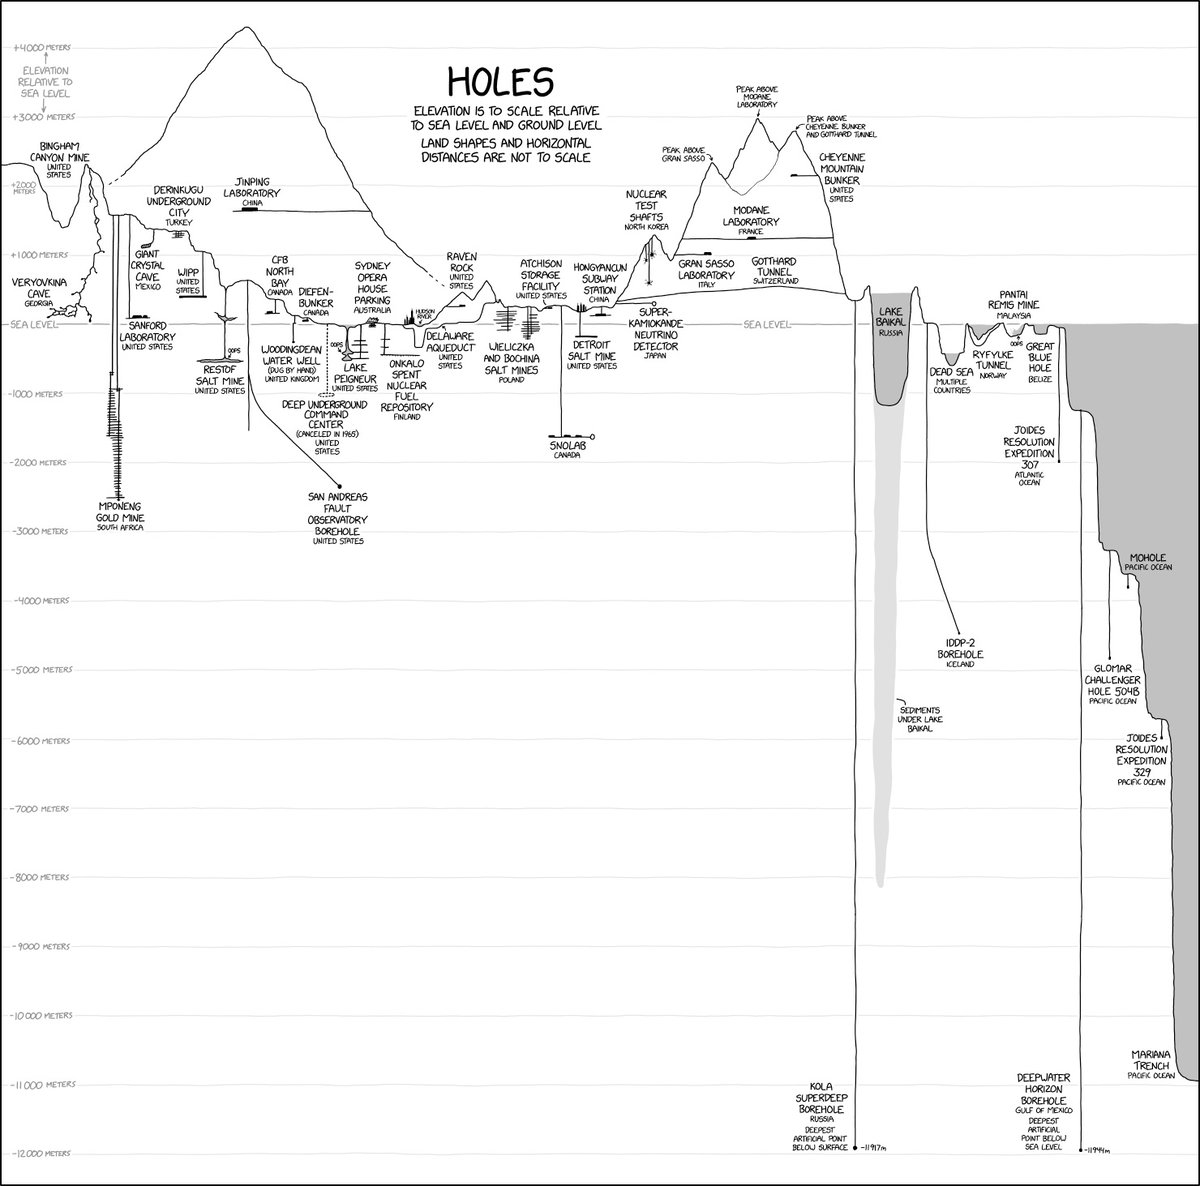
From XKCD, a tour of some of the Earth’s deepest and most notable holes, including mines, caves, boreholes, subway stations, lakes, tunnels, neutrino detectors, and, of course, the Mariana Trench.
I was surprised to learn that a pair of boreholes, the Kola Superdeep Borehole and the Deepwater Horizon Borehole, are actually deeper than the Mariana Trench. Explain XKCD has more info on each of the various holes, including the truly bonkers Cave of Crystals in Mexico.
Twice in the Earth’s history, massive ranges of supermountains have formed on ancient continents.
Studies like these point to something we do know for sure: from the highest peaks to the smallest cells, geology and biology are deeply intertwined. And while it’s often said that we are stardust — built from elements forged in the hearts of dying stars — in a sense, we also might be supermountain dust.
They were perhaps as tall or taller than Everest but their distinguishing feature was their massive breadth — we’re talking ranges 5000 miles long, three to four times the length of the Himalayas — just a unbelievable volume of earth. And their formation may have “fueled two of the biggest evolutionary boom times in our planet’s history”.
That’s a lot of rock to erode — and, according to the researchers, that’s why these enormous mountains are so important.
As both mountains eroded away, they would have dumped tremendous amounts of nutrients like iron and phosphorus into the sea through the water cycle, the researchers said. These nutrients could have significantly sped up biological cycles in the ocean, driving evolution to greater complexity. In addition to this nutrient spillover, the eroding mountains may have also released oxygen into the atmosphere, making Earth even more hospitable to complex life.
I also learned about the Boring Billion from this video, a billion-year period of relative “tectonic stability, climatic stasis and slow biological evolution” nestled in-between the two supermountain eras.
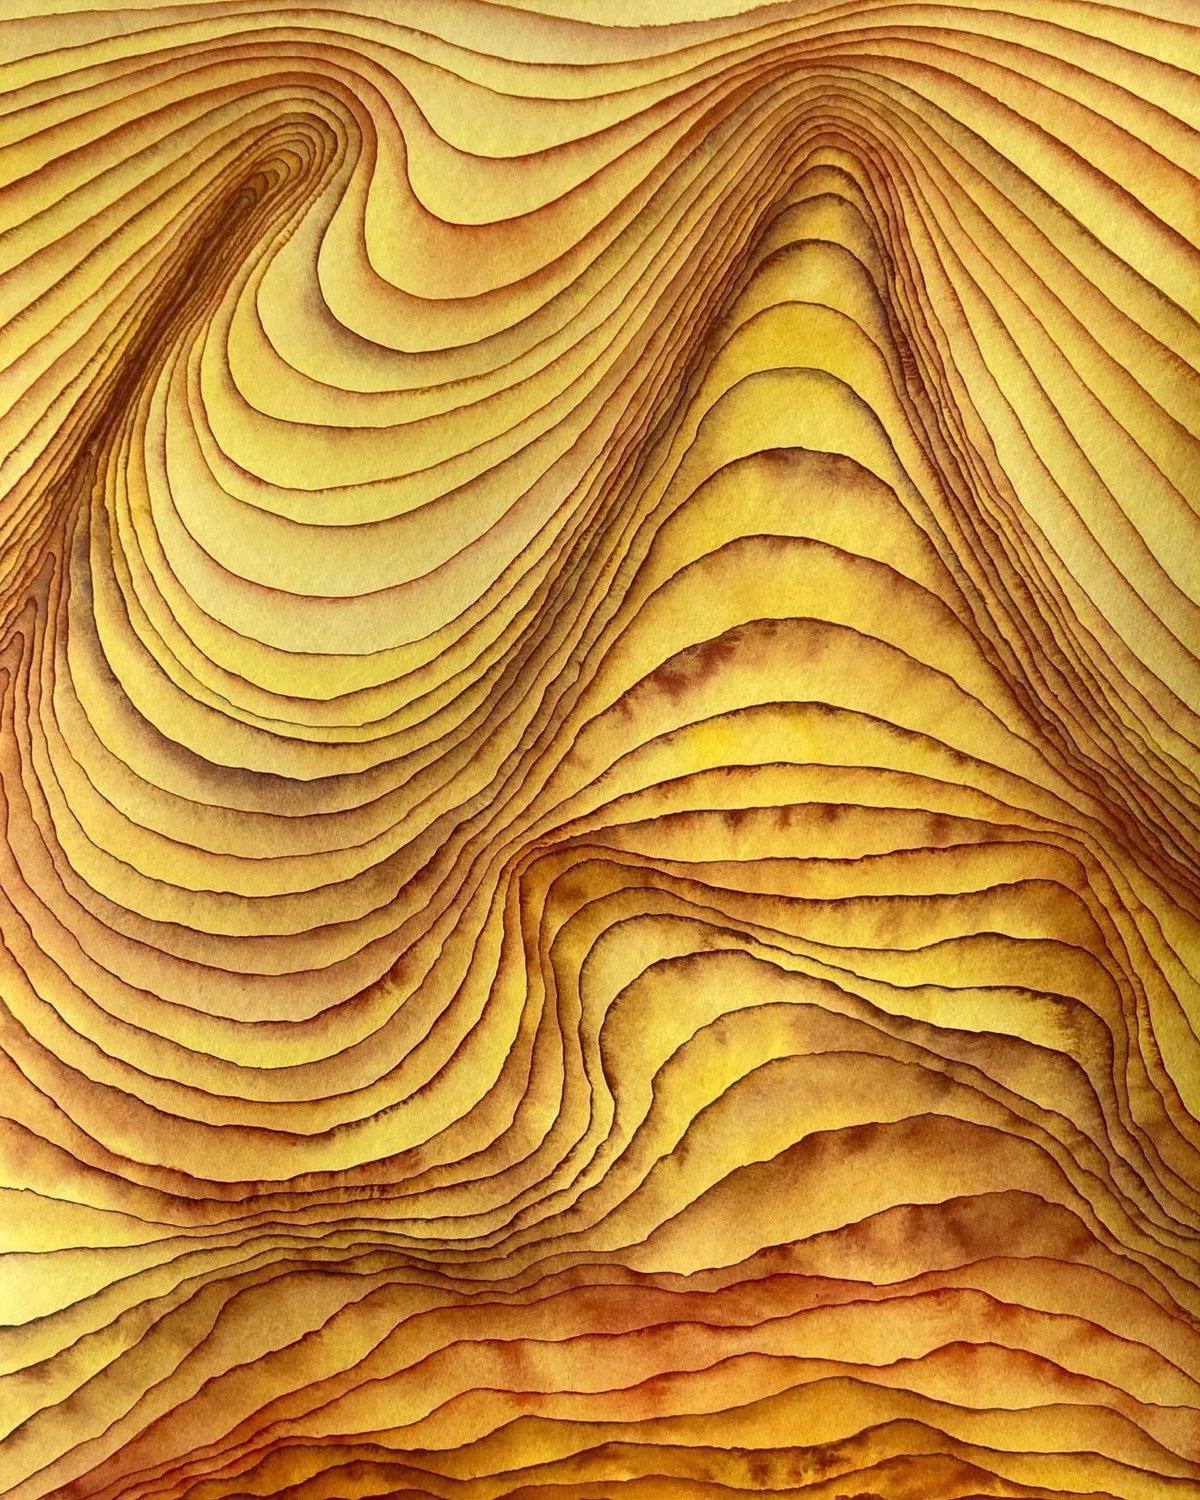
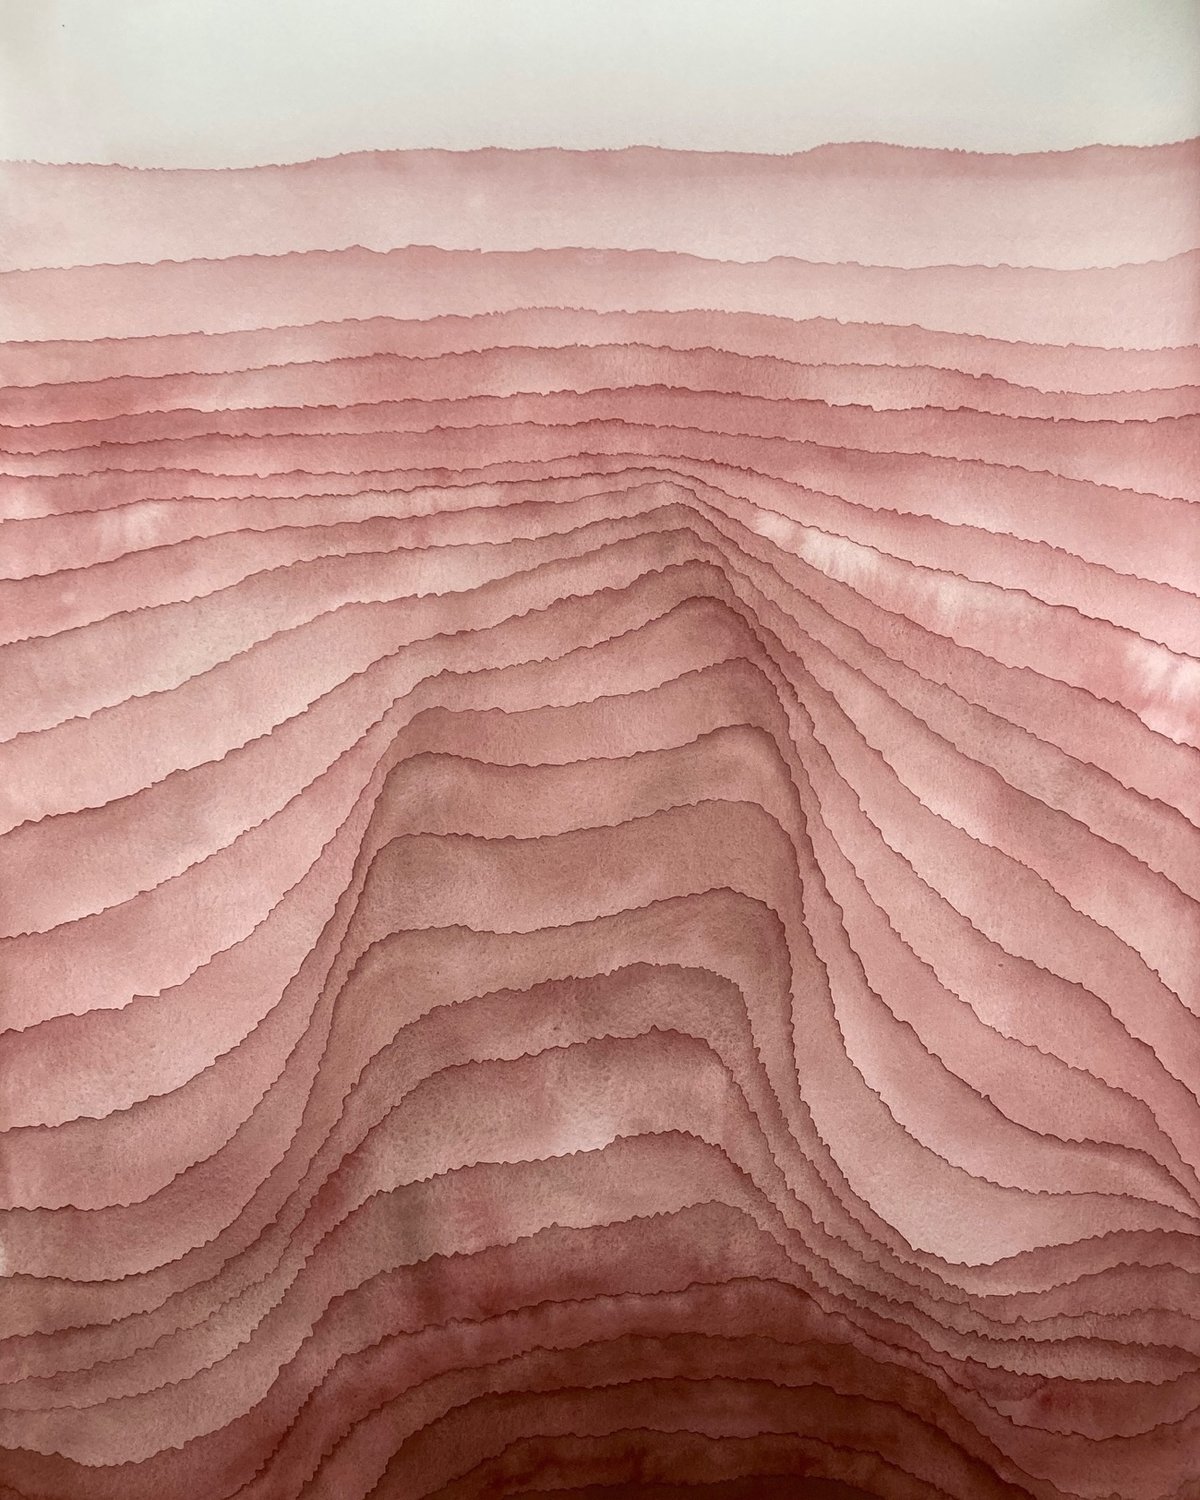
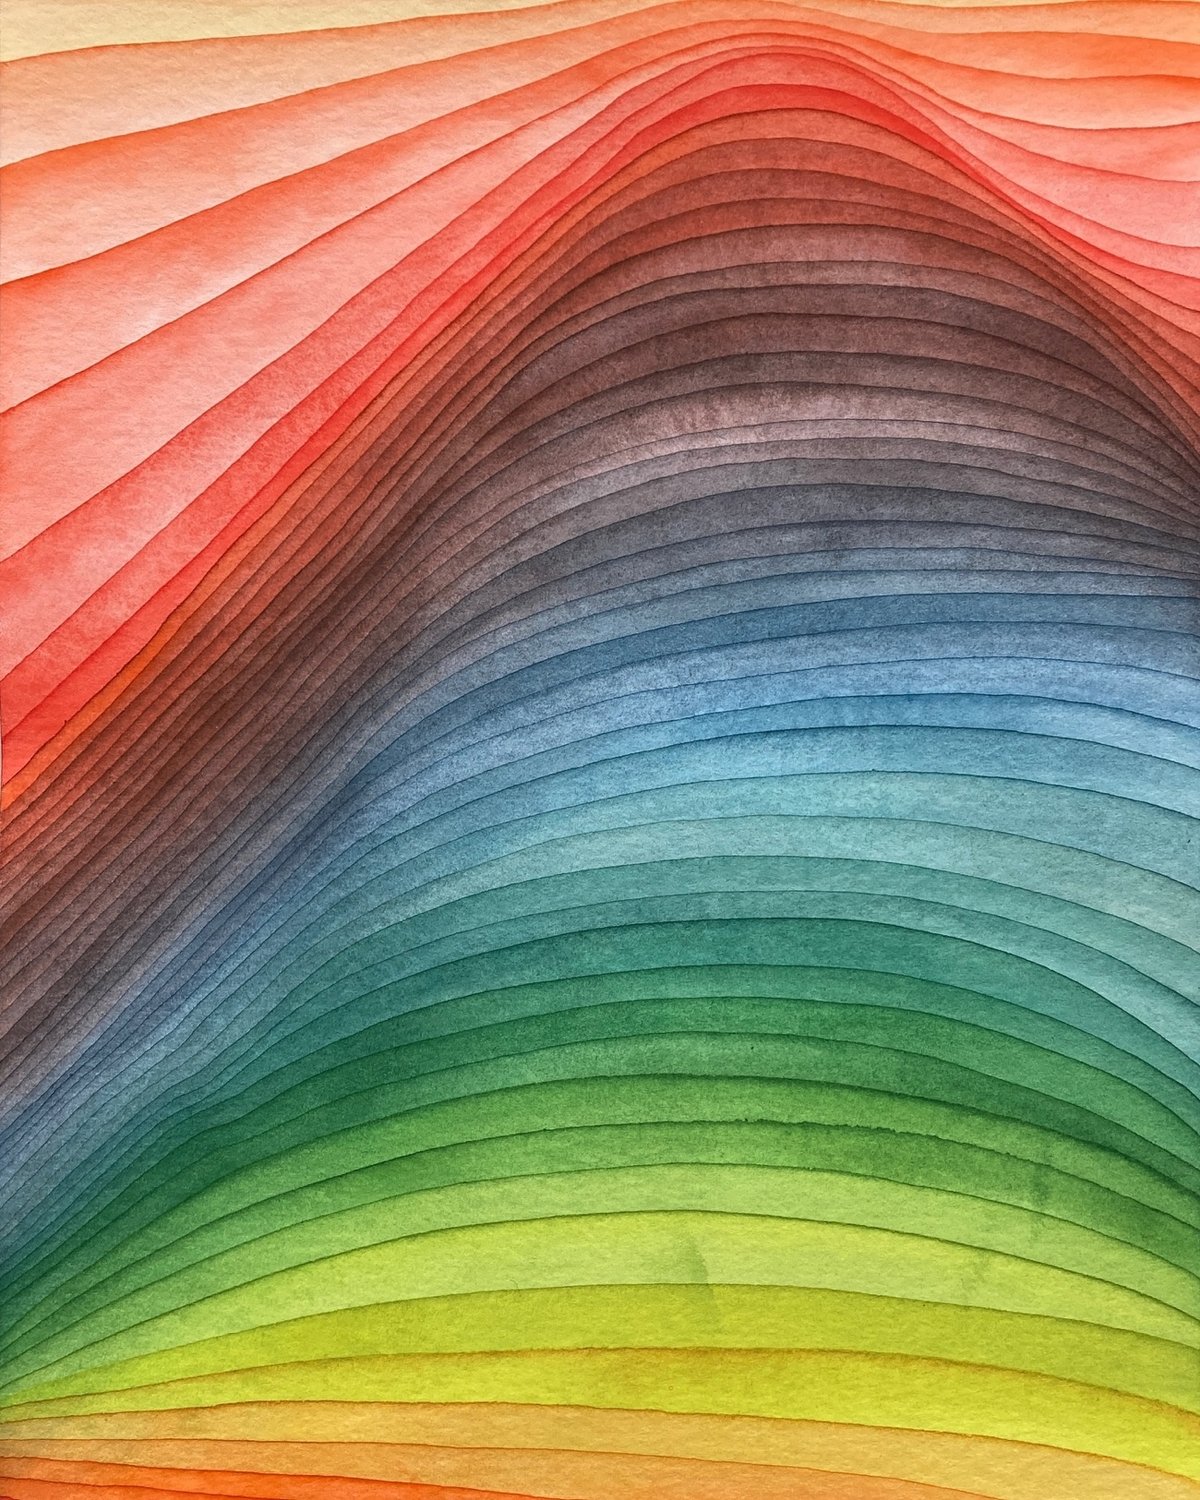
You know me, I love a good gradient. These watercolors are from a series called Strata by Mikael Hallstrøm Eriksen, an artist who uses “repetitive and accumulative mark-making” in his work.
The works in the Strata-series are inspired by geological and natural phenomena — sediments, horisons, bodies of water, etc. These works explore a colourful imagery of accumulation, distance and transformation. Within geology and archeology, strata (singular: stratum) refers to layers (of rock, soil, culture etc.) possessing internally consistent characteristics making them distinguishable from each other.
You can check out more of Eriksen’s work on Instagram.
I am predisposed to like videos about meteorite craters but this was even more interesting than I anticipated.
A nice example of a crater 2-3 km wide is Rotor Kamm in southern Africa. I should mention that we’re easily into city killer impacts here, in case you’re wondering.
You can explore the Earth Impact Database on their website. (via @michaelhobbes.bsky.social)
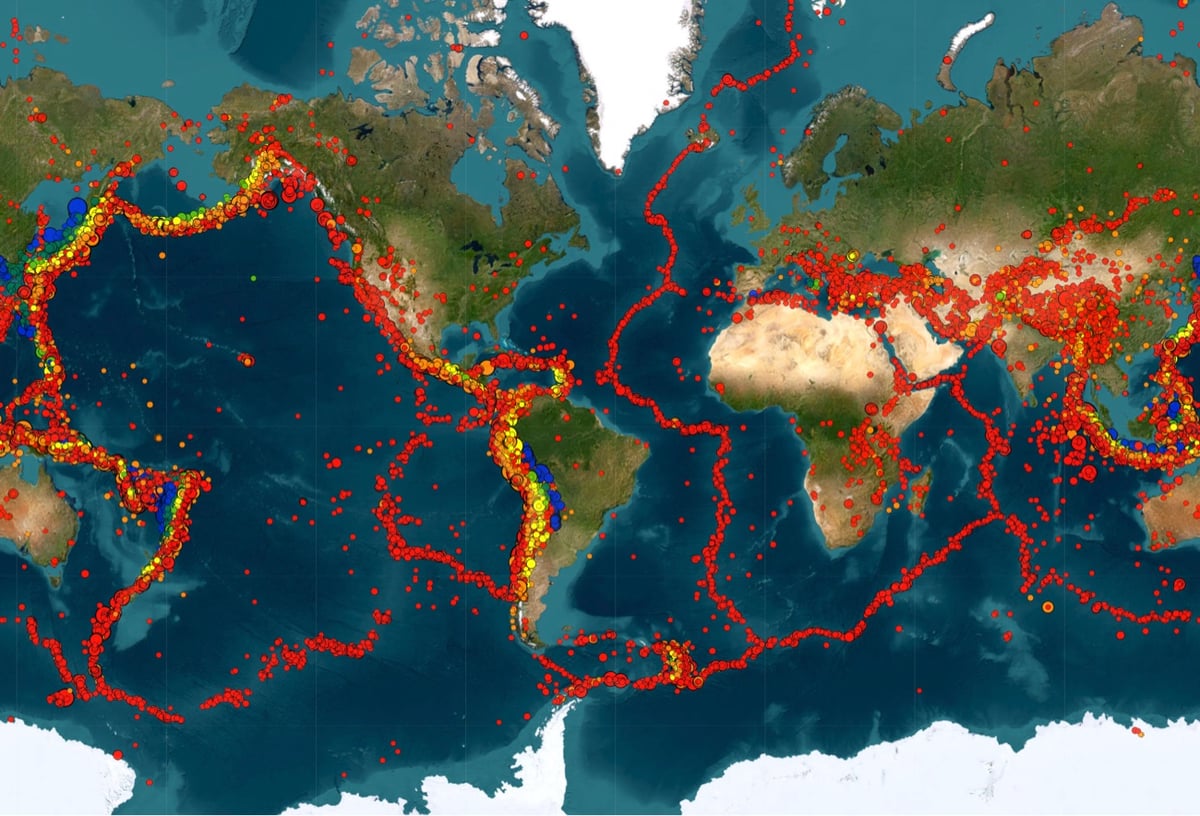
From 1980 to the present, a timeline map of every earthquake in the world with a magnitude of 5 or above. You can play around with different parameters and data, so you can see where the different tectonic plates are, just see where the biggest earthquakes occurred, or add in volcanic eruptions. You can also draw a cross section and it will show how deep the quakes occurred along that line.
Millions of years ago, the supercontinent of Pangea slowly started to break apart into the continents we all live on today. In this video from the makers of ArcGIS mapping software, you can watch as the reconfiguration of the Earth’s land happens over 200 million years.
Damn, India slammed into Asia like the Kool-aid Man — no wonder the Himalayas are so tall!
Once, the craggy limestone peaks that skim the sky of Everest were on the ocean floor. Scientists believe it all began to change about 200 million years ago — at around the time the Jurassic dinosaurs were beginning to emerge — when the supercontinent of Pangea cracked into pieces. The Indian continent eventually broke free, journeying north across the vast swathe of Tethys Ocean for 150 million years until it smacked into a fellow continent — the one we now know as Asia — around 45 million years ago.
The crushing force of one continent hitting another caused the plate beneath the Tethys Ocean, made of oceanic crust, to slide under the Eurasian plate. This created what is known as a subduction zone. Then the oceanic plate slipped deeper and deeper into the Earth’s mantle, scraping off folds limestone as it did so, until the Indian and Eurasian plates started compressing together. India began sliding under Asia, but because it’s made of tougher stuff than the oceanic plate it didn’t just descend. The surface started to buckle, pushing the crust and crumples of limestone upwards.
And so the Himalayan mountain range began to rise skyward. By around 15-17 million years ago, the summit of Everest had reached about 5,000m (16,404ft) and it continued to grow. The collision between the two continental plates is still happening today. India continues to creep north by 5cm (2in) a year, causing Everest to grow by about 4mm (0.16in) per year (although other parts of the Himalayas are rising at around 10mm per year [0.4in]).
See also Map of Pangaea with Modern-Day Borders, How the Earth’s Continents Will Look 250 Million Years From Now, and Locate Modern Addresses on Earth 240 Million Years Ago. (via open culture)
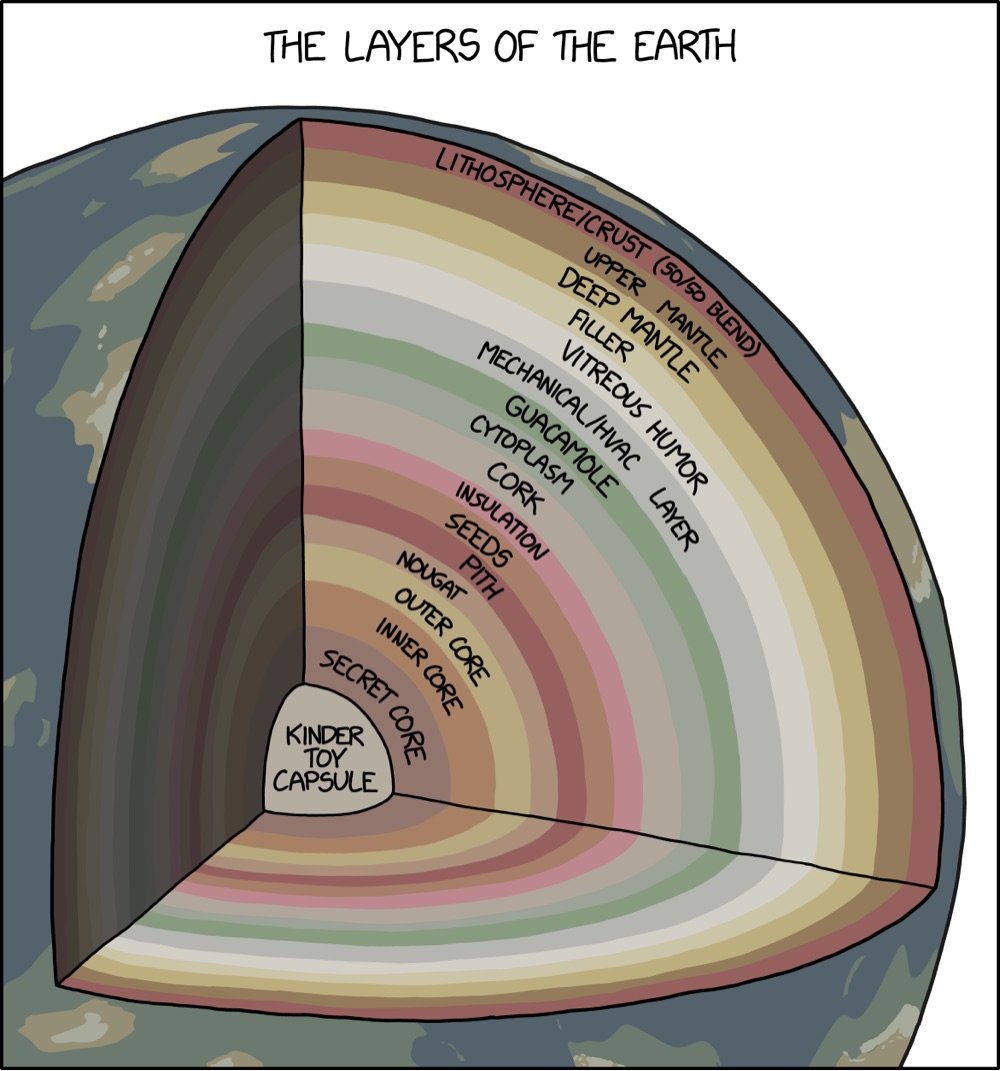
From XKCD, a 3D cutaway map of the many layers of the Earth, from the familiar crust around the outside to the more mysterious layers like nougat, vitreous humor, guacamole, and cork.
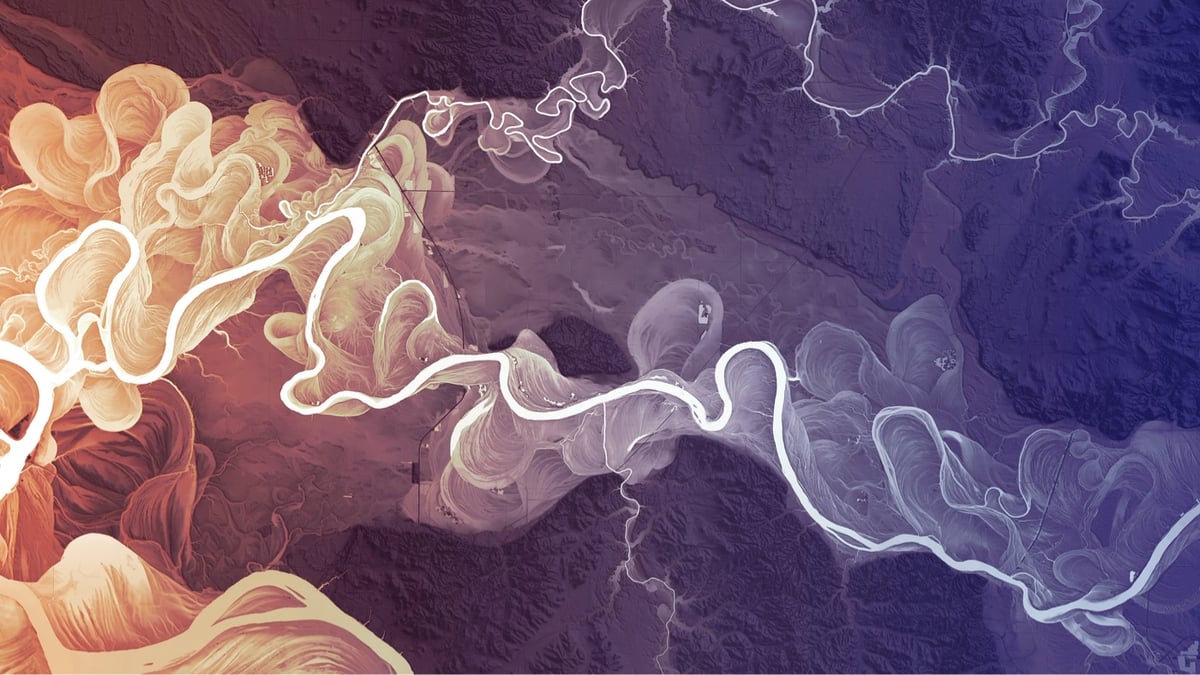
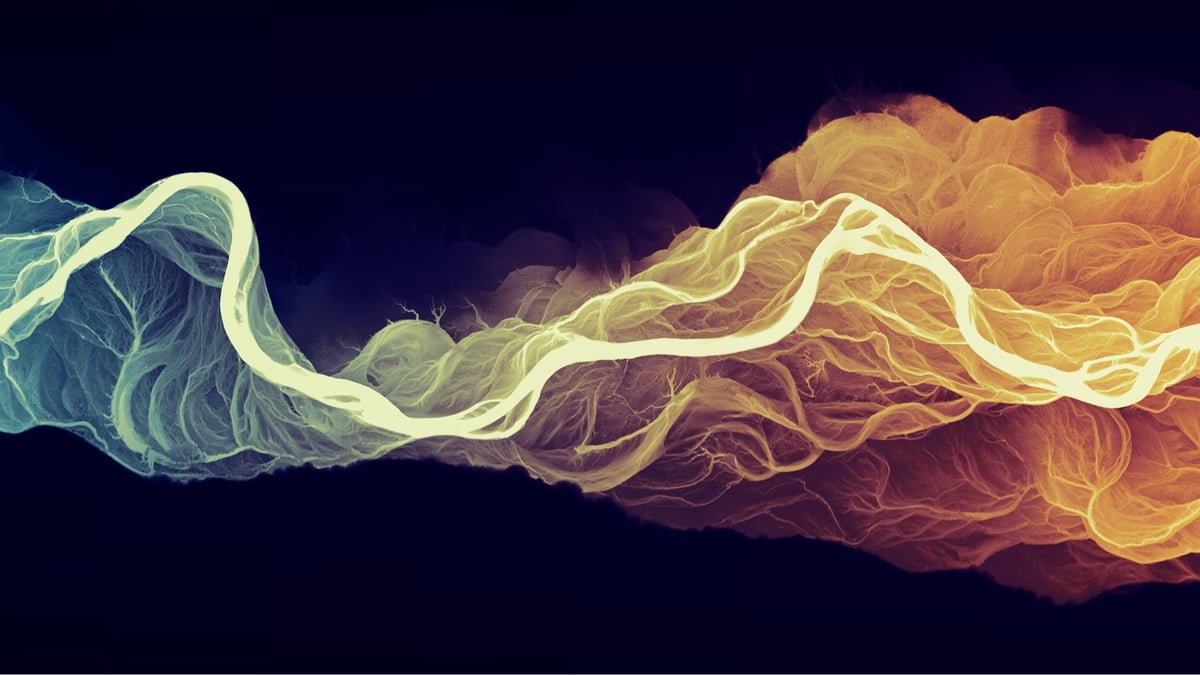
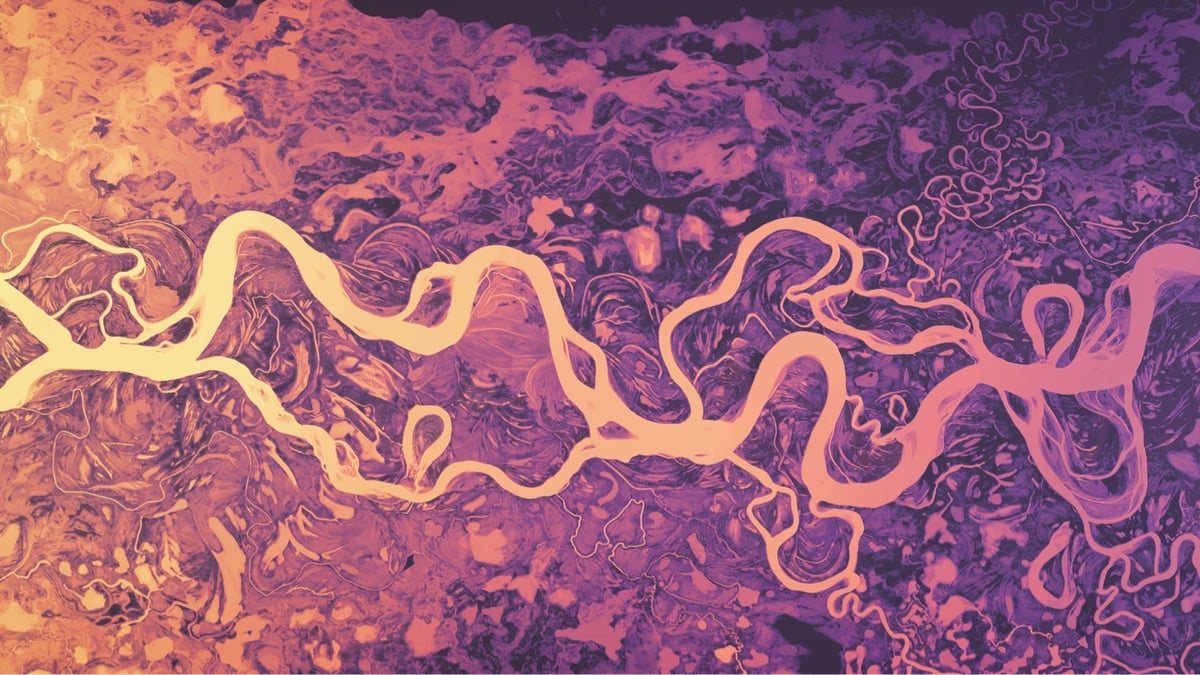
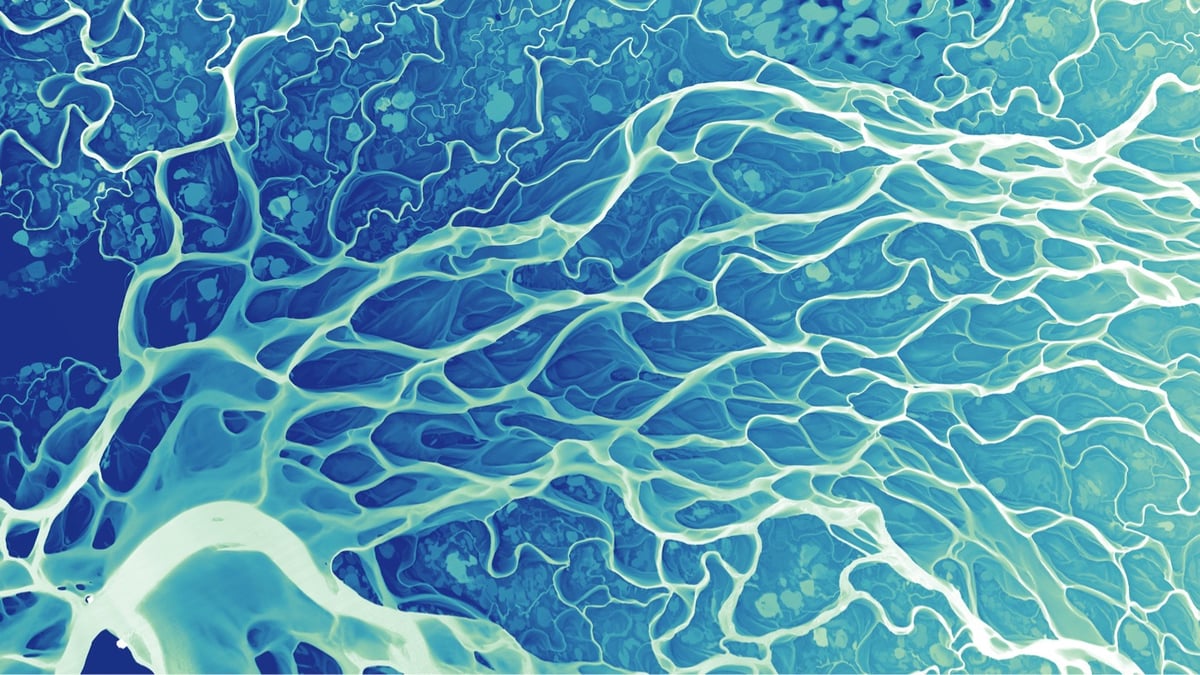

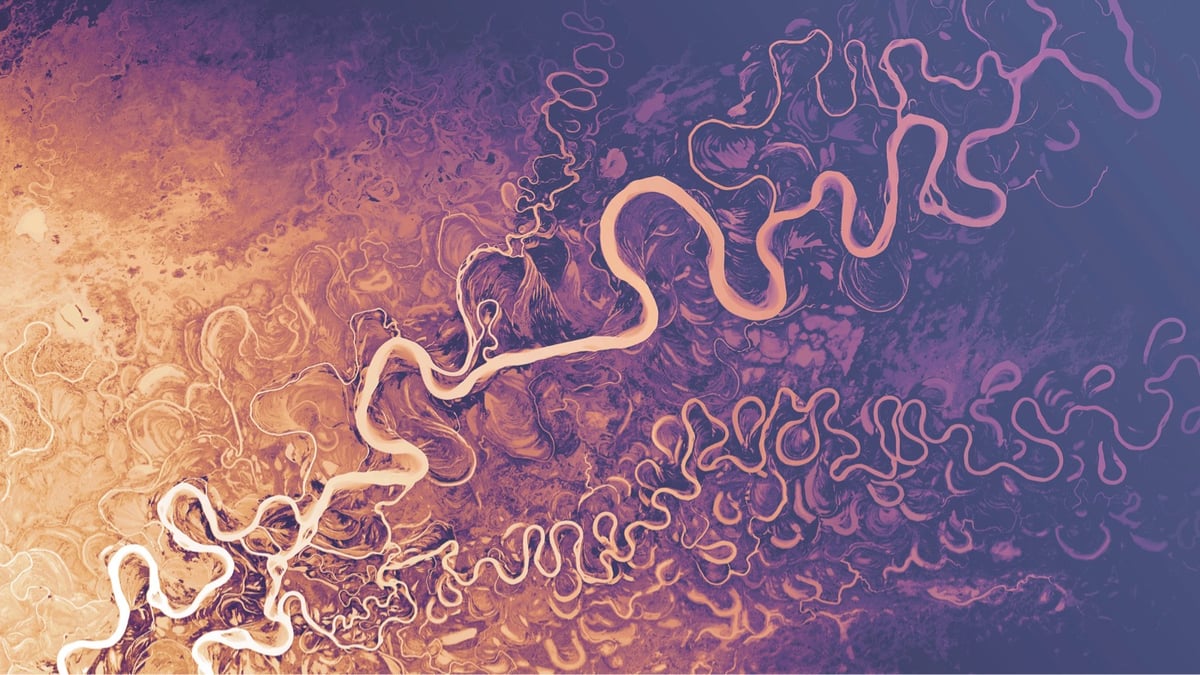
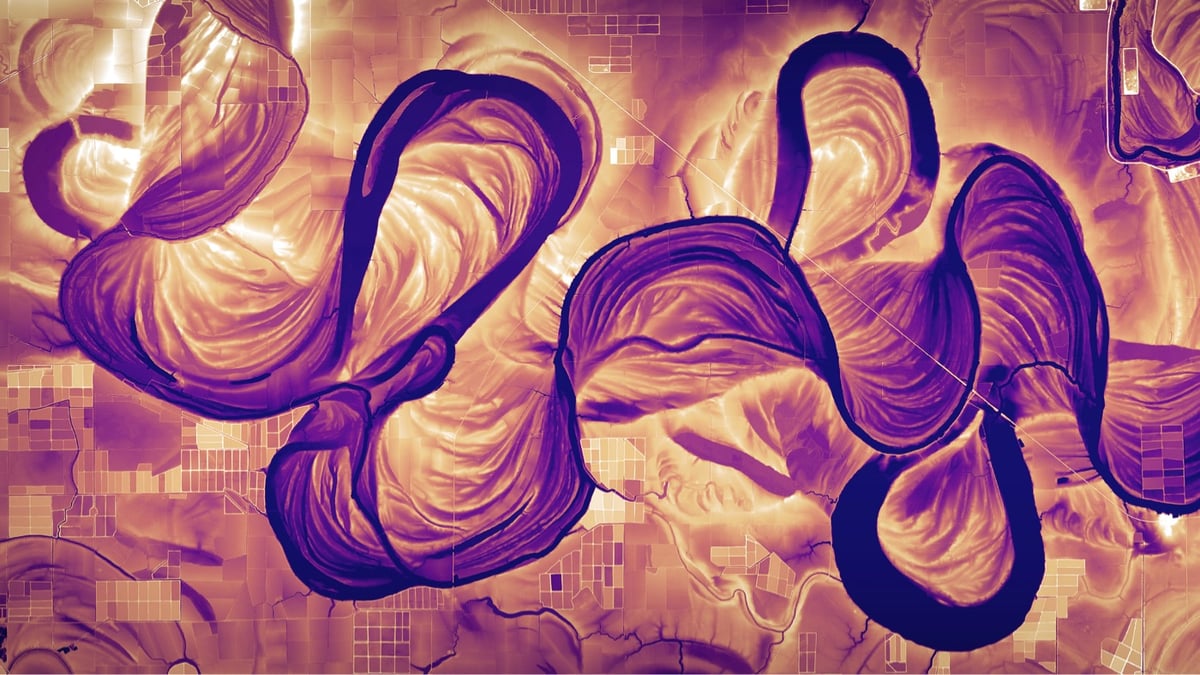
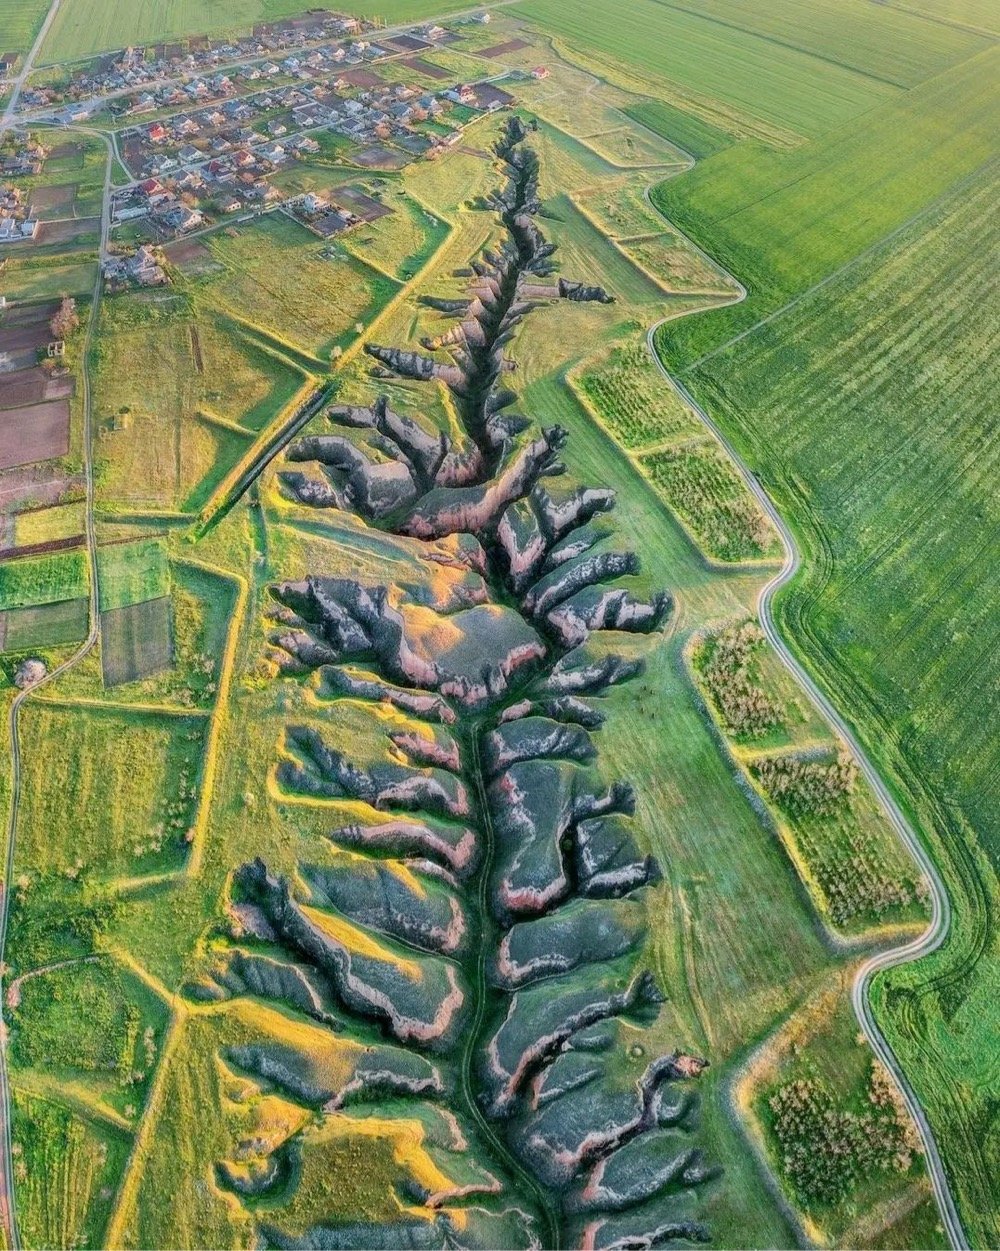
I cannot get enough of Dan Coe’s high-resolution images of rivers and river deltas constructed from lidar data. So swirly, swoopy, fractally, and squiggly! Many of these images are time machines, showing the various meanders these rivers took hundreds and thousands of years ago. As I wrote in a post about the Mississippi River meander maps designed by Army Corps of Engineers cartographer Harold Fisk:
Fisk’s maps represent the memory of a mighty river, with thousands of years of course changes compressed into a single image by a clever mapmaker with an artistic eye. Looking at them, you’re invited to imagine the Mississippi as it was during the European exploration of the Americas in the 1500s, during the Cahokia civilization in the 1200s (when this city’s population matched London’s), when the first humans came upon the river more than 12,000 years ago, and even back to before humans, when mammoths, camels, dire wolves, and giant beavers roamed the land and gazed upon the river.
Coe has put 4K versions of these images up on Flickr in both landscape and portrait aspect ratios. They work really well for computer and phone wallpapers — I’ve been using this one on various devices since I first saw it years ago.
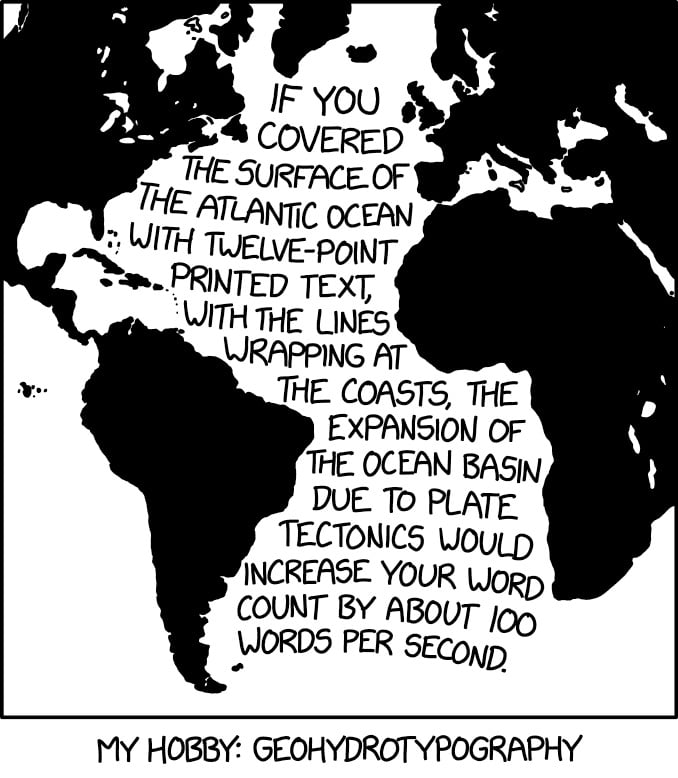
This, from XKCD, hits my science and design interests right in the sweet spot.
If you covered the surface of the Atlantic Ocean with twelve-point printed text, with the lines wrapping at the coasts, the expansion of the ocean basin due to tectonics would increase your word count by about 100 words per second.
This reminds me of Ben Terrett’s calculation of how many helveticas from here to the Moon and my subsequent calculations about the point size of the Earth and the Moon (50.2 billion and 13.7 billion, respectively).
Heidi Gustafson is the curator of Ochre Sanctuary, a collection of iron-based earths that are the oldest natural pigments used by humans. In her new Book of Earth, Gustafson details where these pigments come from and how to use them to create art. Here are a few images from the book and the Ochre Sanctuary:
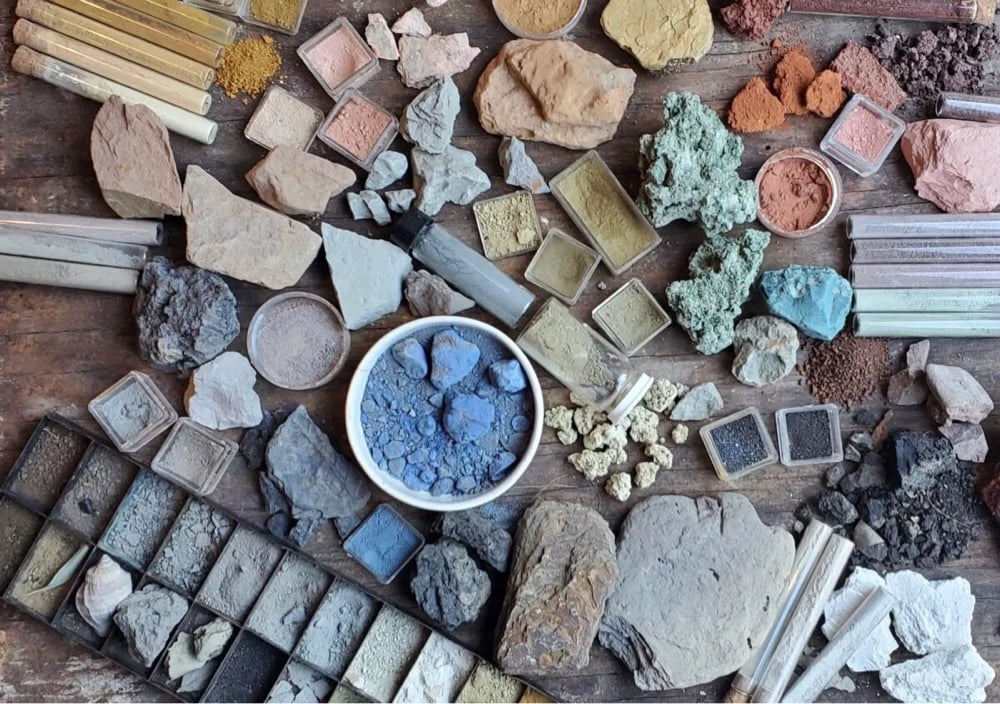
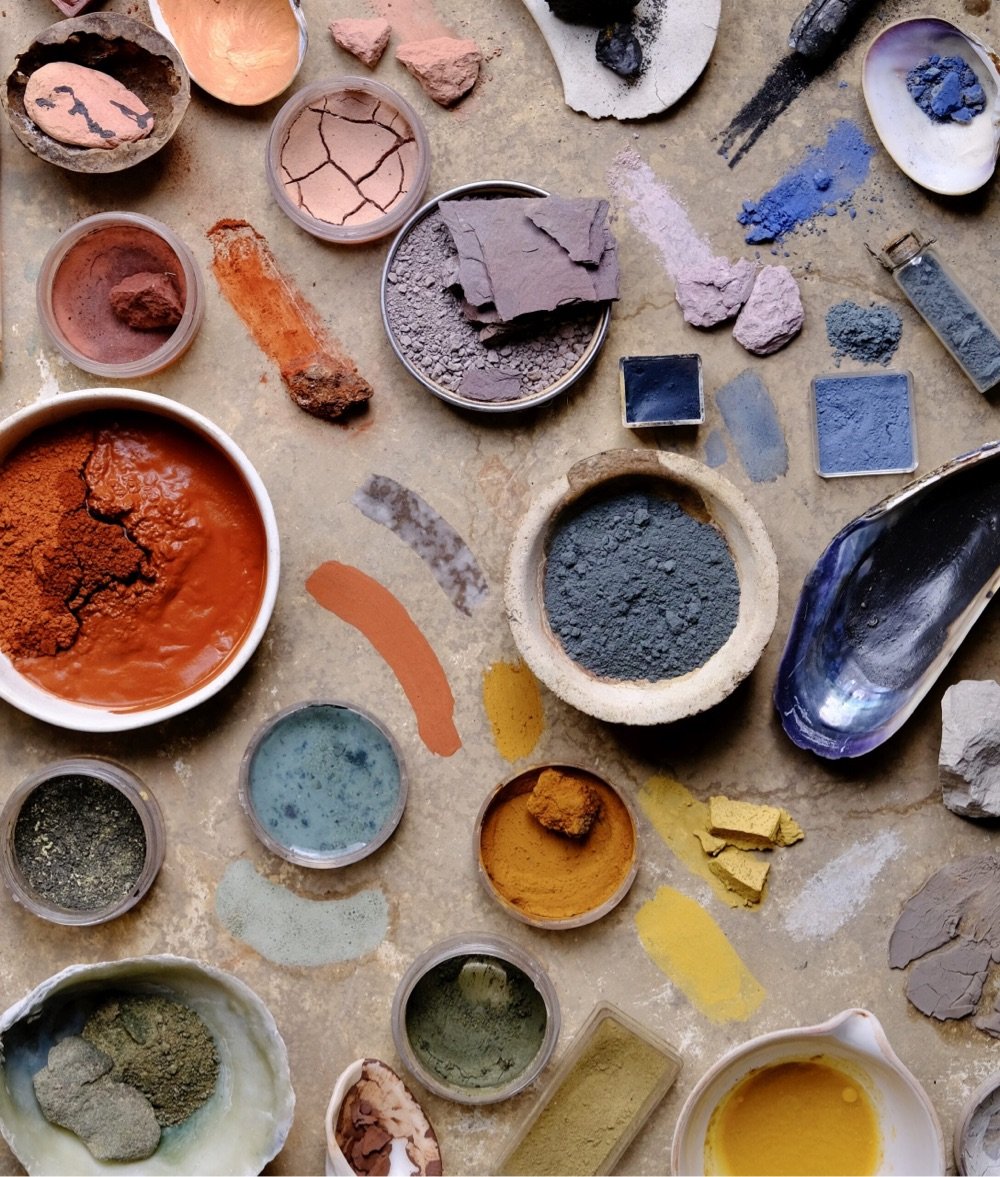
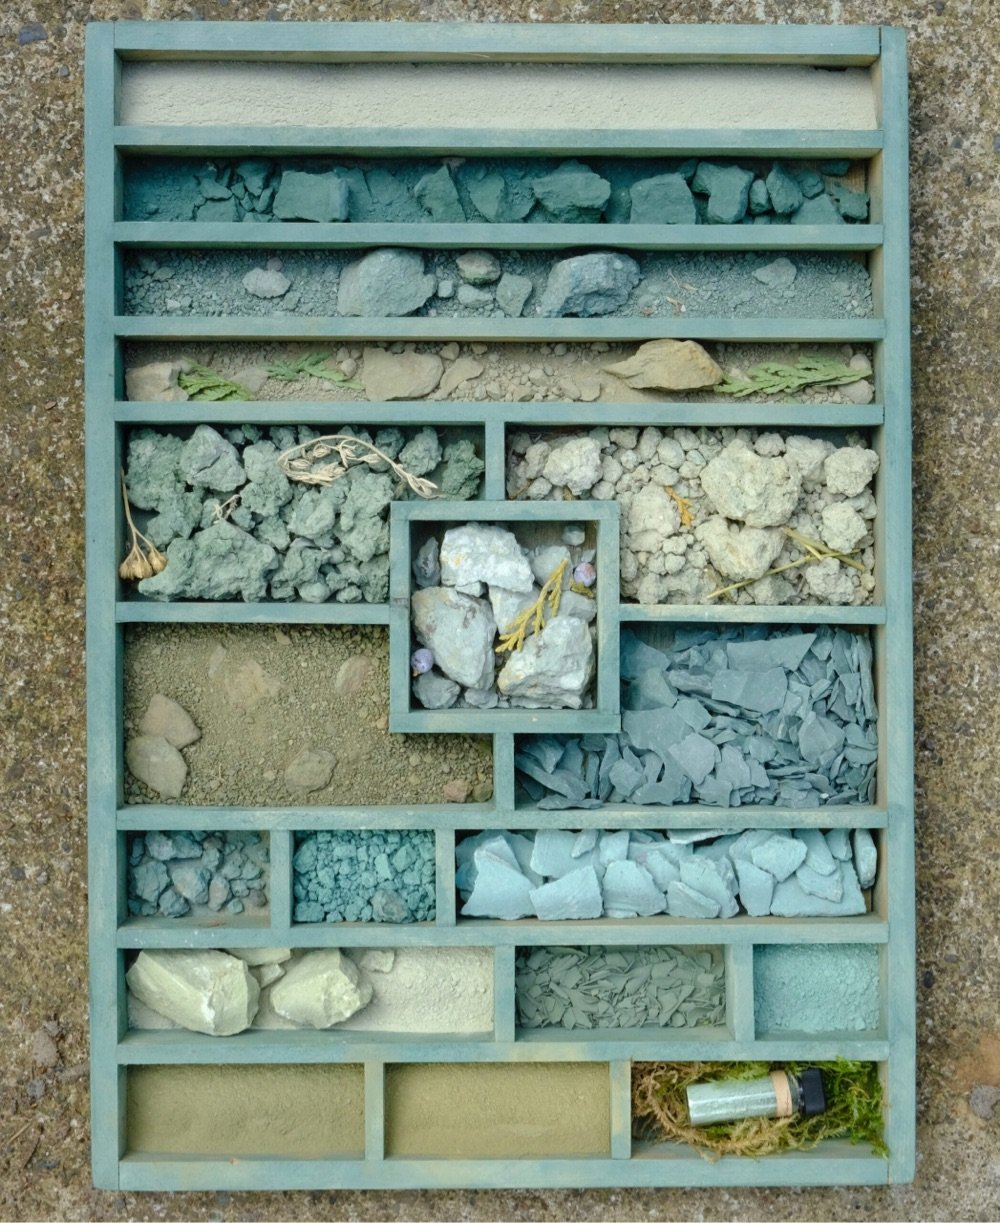
Looks like a gorgeous book. Check out her Instagram for more colorful photos of ochres.
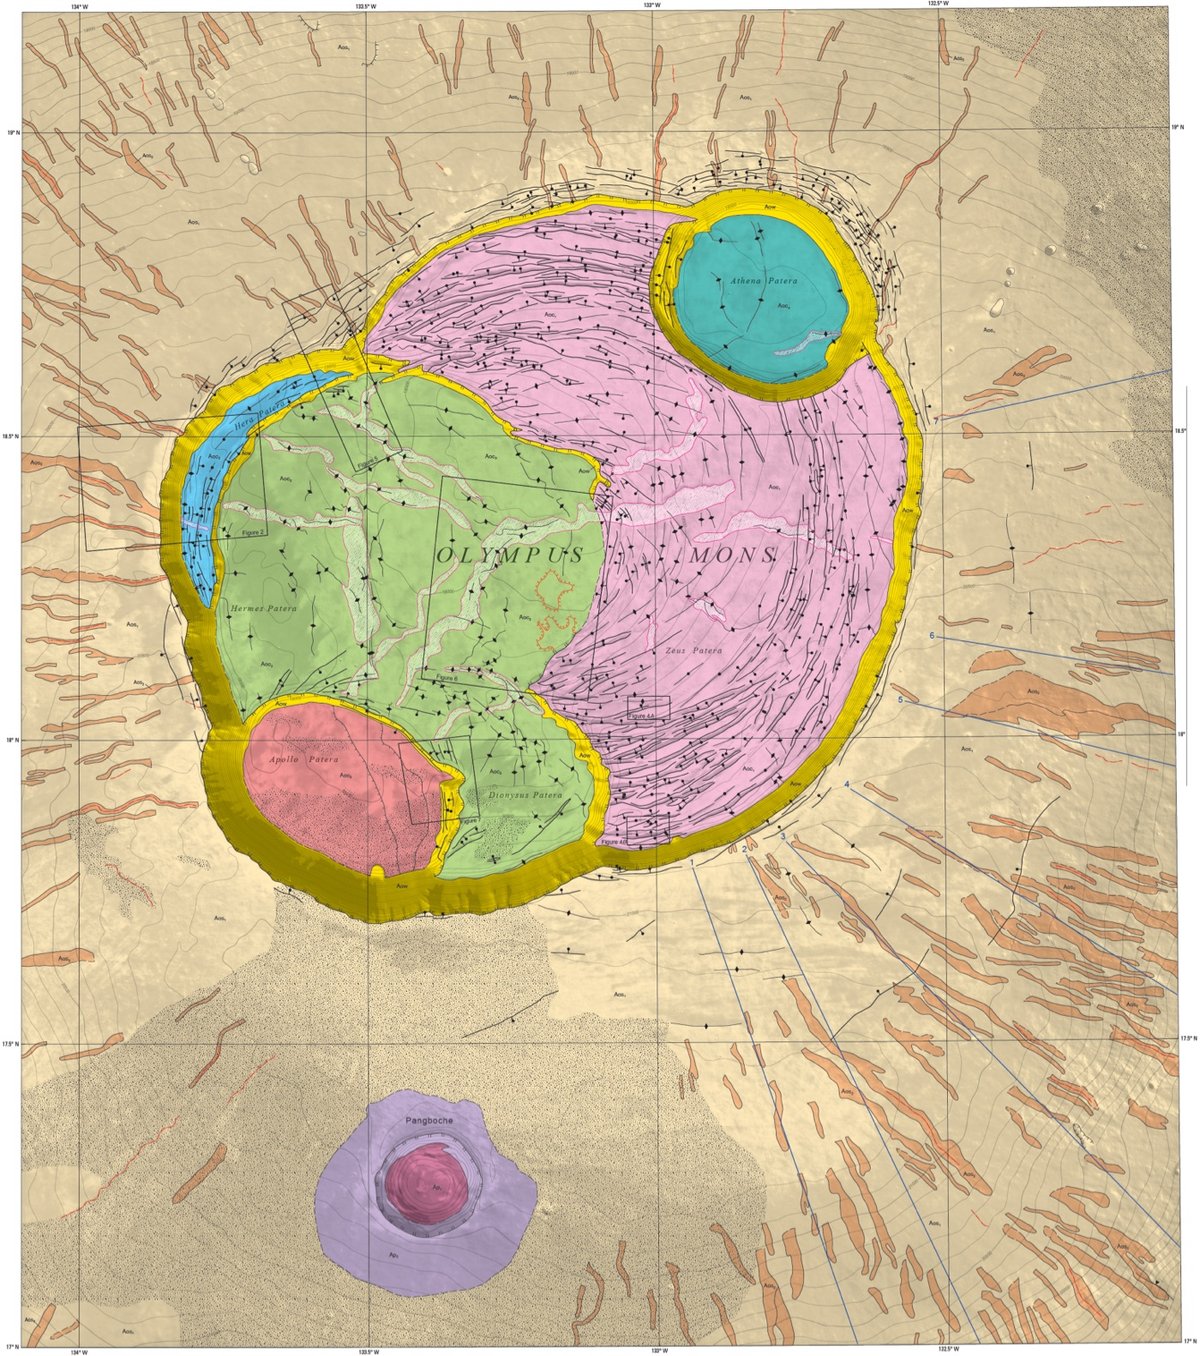
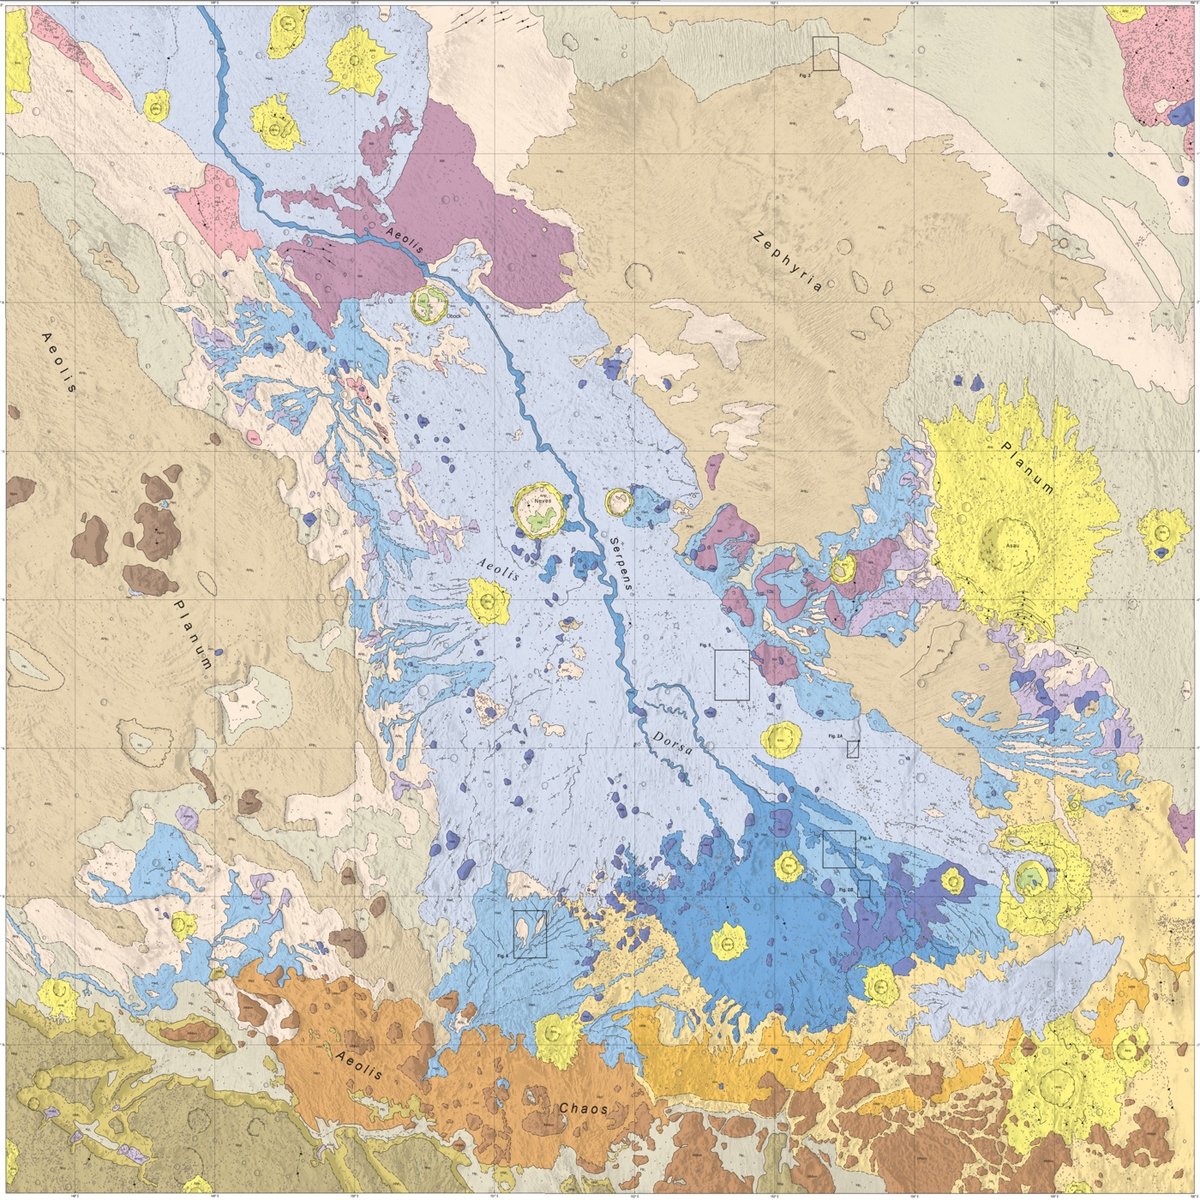
The USGS Astrogeology Science Center recently released a series of detailed geological maps of Mars that detail features from the red planet’s past like volcanos and flowing water. If you’re thinking, “hey that looks a lot like a river in that second image”, you’re not far off.
One particularly interesting feature that hints at Mars’ watery past is the sinuous ridge, which is a winding, narrow ridge that looks like an inverted river channel. These ridges are interpreted to be aqueous (formed by water), making them possible clues about the history of water on Mars.
The scale of the maps is useful for identifying geologic changes over time:
The new map of Aeolis Dorsa adds to the hypothesis that Mars was once wet and had abundant active river systems in the past before aqueous activity decreased over time. This change caused the primary depositional methods in the region to shift from rivers (fluvial) to sediment fans with intermittent deposition (alluvial) and eventually to a dry and wind-driven (aeolian) system. This local pattern mimics our current understanding of the global environmental history of Mars.
Lovely aesthetics as well. (via @geoffmanaugh)
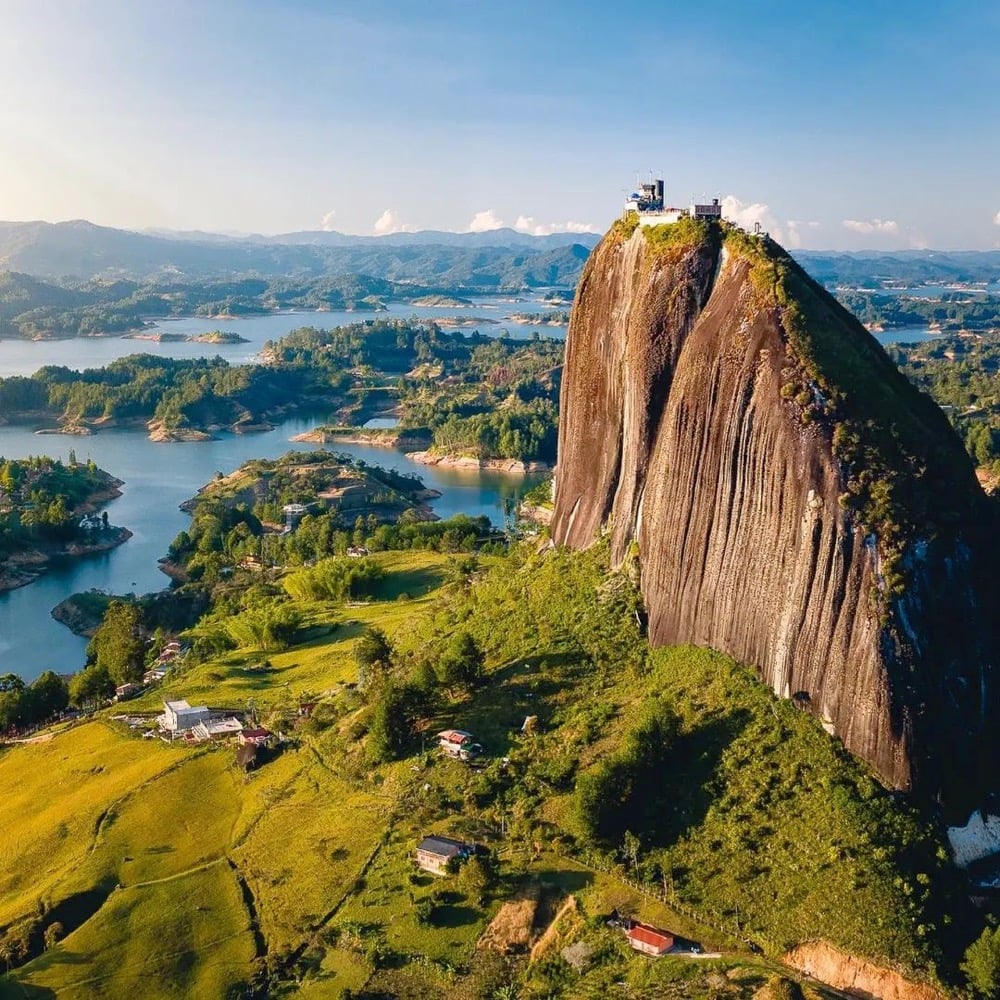
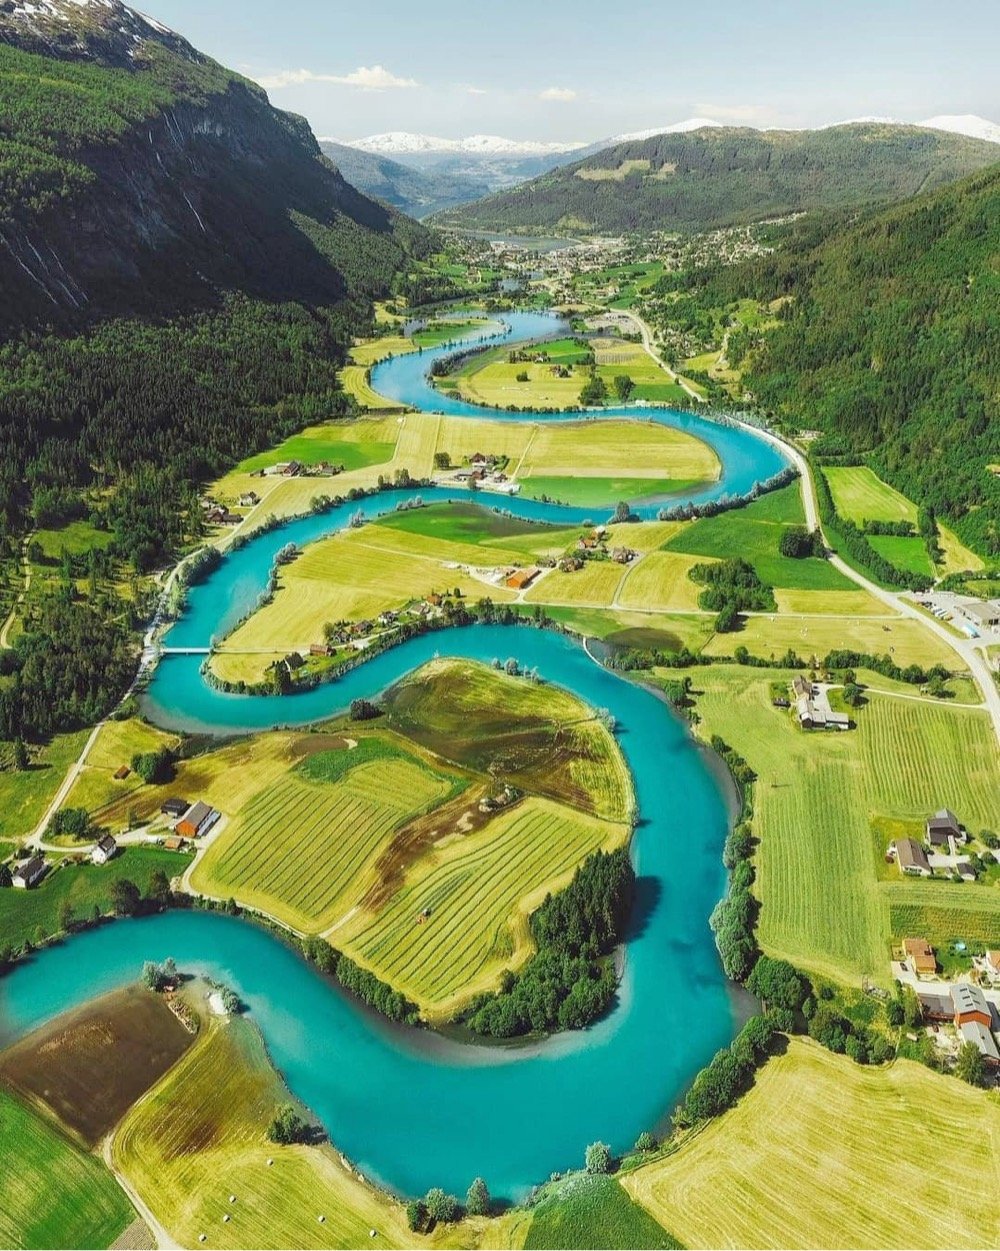
The Instagram account Geomorphological Landscapes features some of the more beautiful and unusual natural and geological features our planet has to offer, including inselbergs, caves, murmurations, ice balls, clouds, and river meanders. The account doesn’t stick to strictly natural wonders, but whatever they post is usually worth a look. (via dense discovery)
About 5.9 million years ago, due to a combination of tectonic movements and changes in climate, the Mediterranean Sea mostly dried up for over 600,000 years. The Messinian salinity crisis may have raised global sea levels by as much as 33 feet and decreased the salinity of the world’s oceans, raising the freezing point. And then, much more suddenly, it was refilled in less than two years in the Zanclean Flood.
Two years to refill the whole Mediterranean! Apparently the water level rose at 30 feet per day, fed by a river that carried 1000 times more water than the Amazon at velocities exceeding 88 mph. When the water reached a barrier near present-day Sicily, it flowed into the eastern basin via a mile-high waterfall in which the water was moving at 100 mph. The weight of so much water moving into the area so quickly would have triggered seismic activity, resulting in landslides that could have produced tsunamis with wave heights of 330 feet. So much wow!
Anyway, watch the PBS Eons video above for the whole story. And then check out this animation of what the drying up and the flood may have looked like.
P.S. For XKCD, Randall Munroe wrote a comic called Time that unfolded over a series of four months and was based on a future Zanclean-like flood. (via open culture)
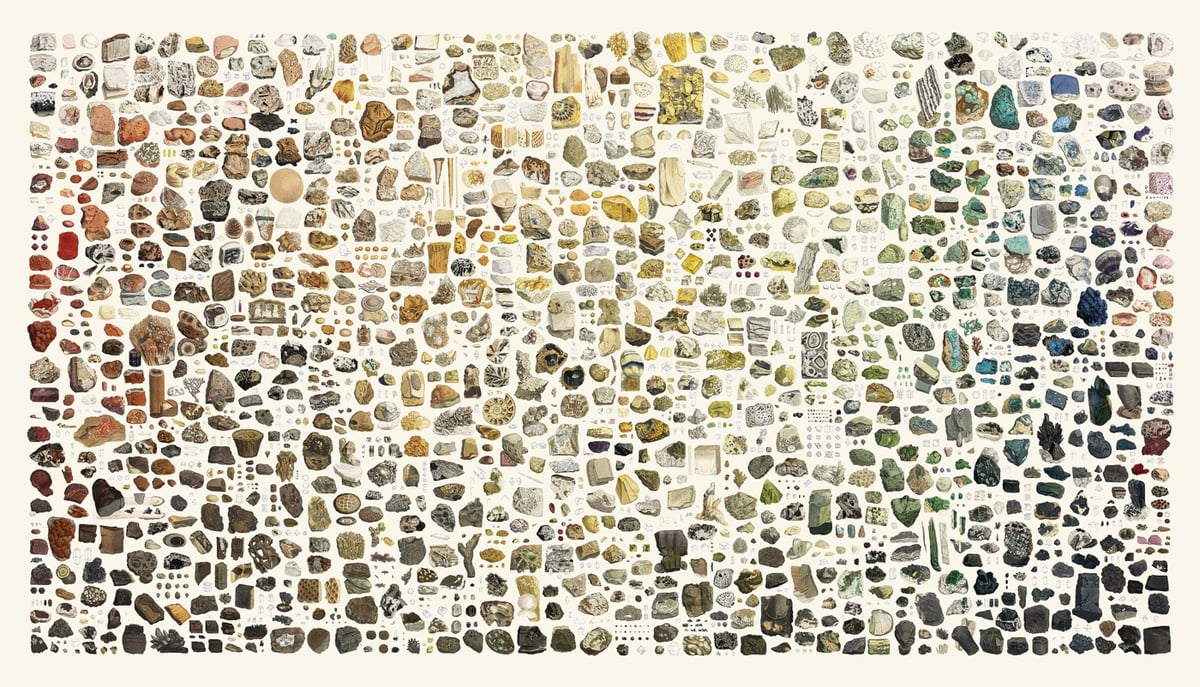
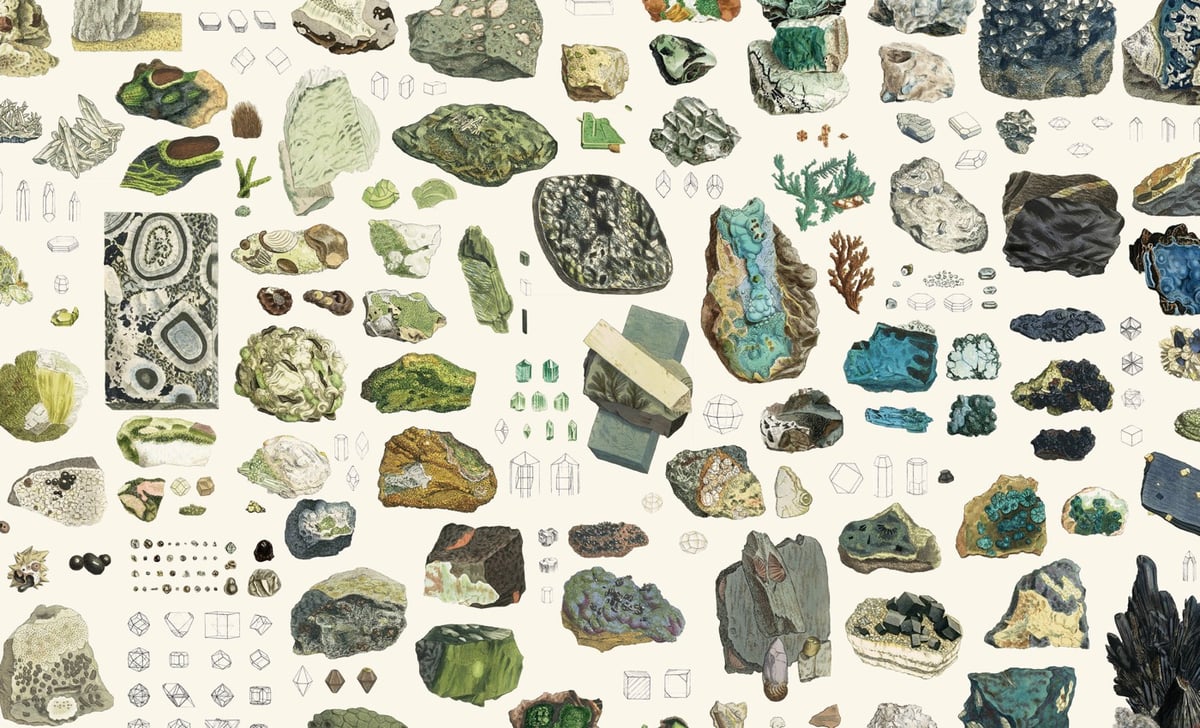
I love this zoomable interactive display of British & Exotic Mineralogy. To create it, Nicholas Rougeux collected 718 hand-drawn mineral illustrations by James Sowerby sourced from a pair of multi-volume books called British Mineralogy and Exotic Mineralogy, published between 1802 and 1817. Then he arranged them according to hue and brightness in a collage worthy of Knoll.
British Mineralogy and Exotic Mineralogy comprise 718 illustrations by James Sowerby in an effort to illustrate the topographical mineralogy of Great Britain and minerals not then known to it. Sowerby’s plates are some of the finest examples of hand-drawn mineral illustrations ever created. The detail and care with which these illustrations were created is incredible and worthy of close examination. See the samples below.
And, oh boy, he’s selling posters of it too.
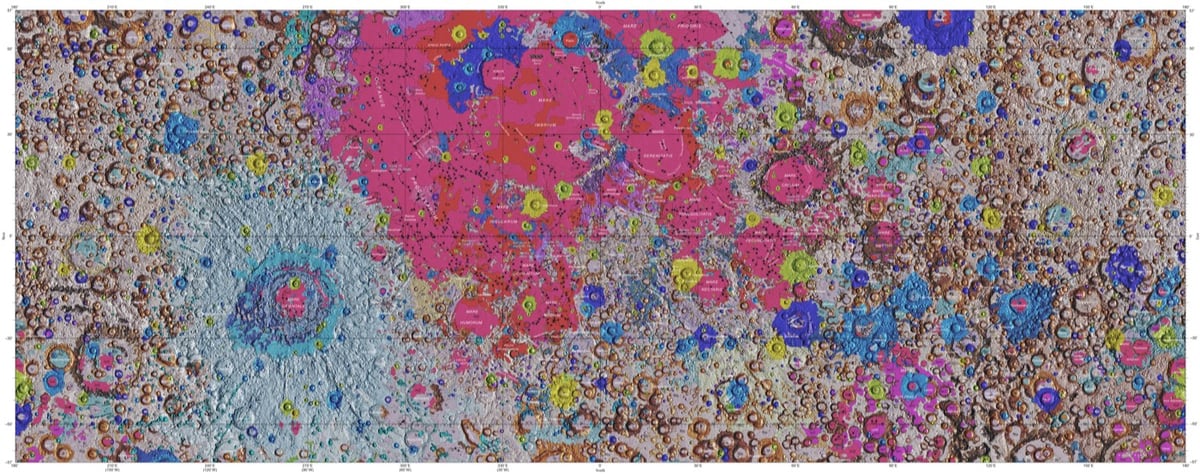
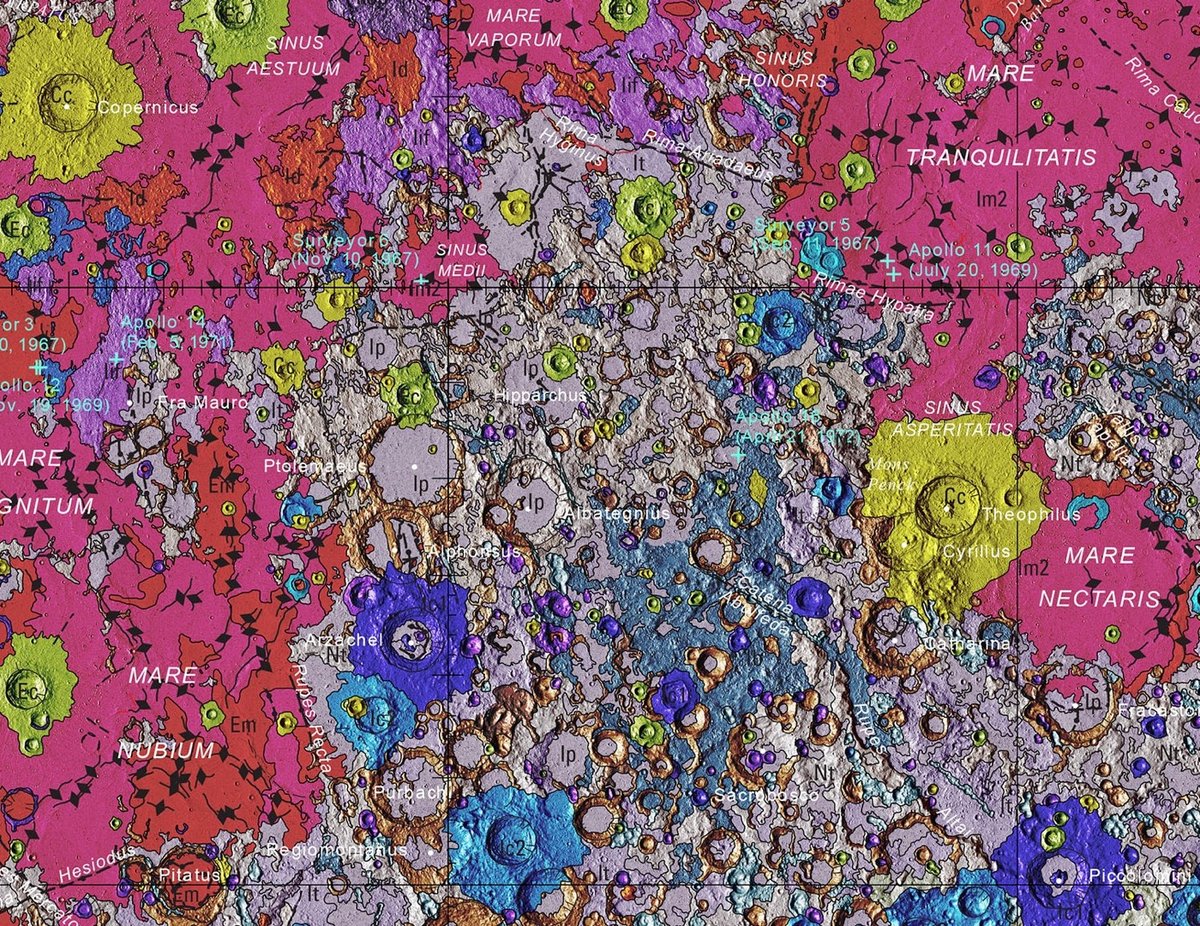
In collaboration with NASA and the Lunar and Planetary Institute, the USGS has released the first complete geological map of the Moon’s surface.
This new work represents a seamless, globally consistent, 1:5,000,000-scale geologic map derived from the six digitally renovated geologic maps (see Source Online Linkage below). The goal of this project was to create a digital resource for science research and analysis, future geologic mapping efforts, be it local-, regional-, or global-scale products, and as a resource for the educators and the public interested in lunar geology.
Strange Maps has more information on how the map came to be and what it shows.
The map was created by the U.S. Geological Service’s Astrogeology Science Center in Flagstaff, Arizona. In collaboration with NASA and the Lunar and Planetary Institute, it combined six ‘regional’ maps of the Moon made during the Apollo era (1961-1975) with input from more recent unmanned lunar missions.
This included data on the polar regions from NASA’s Lunar Orbiter Laser Altimeter (LOLA) and close-ups of the equatorial zone from the Japanese Space Agency’s recent SELENE mission.
The two images above show the entire map and a detailed view of a single area (which includes the landing sites of 3 Apollo missions) while the video shows a rotating globe version of the map.
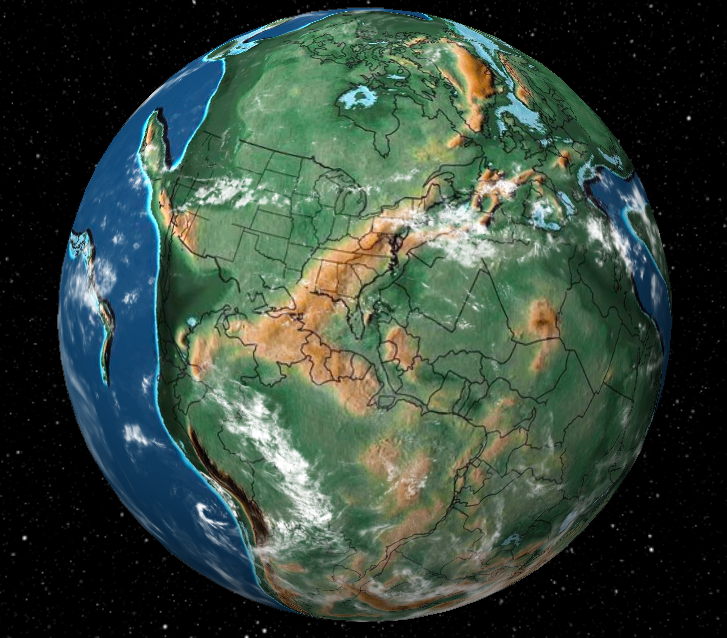
This is fun to play with: Dinosaur Pictures has a Google Earth-style globe that shows the state of the planet at various intervals 20 million, 200 million, or 750 million years ago, with plenty of stops in between. You can watch India collide into the rest of Asia, or jump to the birth (and death) of dinosaurs, the first flowers, the first hominids, etc. And you can watch the whole planet or zero in on an individual contemporary address.
One point of view that I found oddly soothing: the middle of the Pacific Ocean. All over the planet, millions of years are passing by, transforming the land-bound flora and fauna through tectonic and climatic upheavals, and the ocean just… stays the ocean. Big things are happening below the surface, but the biggest part of the planet just continues to be this deep blue, undisturbed marble.
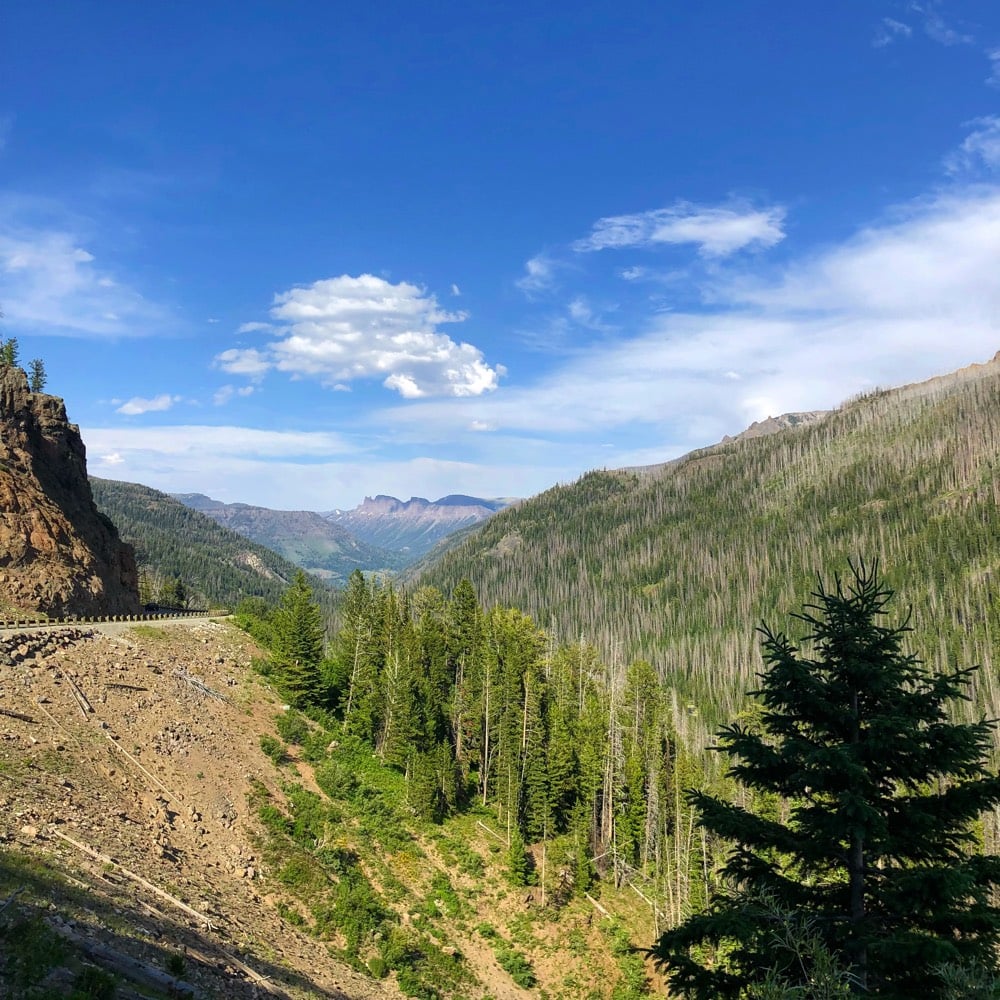
Last week, I stood in the middle of the caldera of a supervolcano, walked on rocks billions of years old, and traveled back in time simply by driving down a mountain. I looked a bison in the eye at five yards. I witnessed the final resting place of a 12 million-year-old fossilized horse buried in volcanic ash. I saw a rainbow emerging from a mighty thundercloud — powerful with a little bit of tender. I talked civilly with red hatters in red states and found some common ground at least. I drove across the western United States, from Iowa to Oregon, over the course of 10 days. Here is some of what I saw and learned.
Biggest surprise of the trip, part 1: The Bighorn Mountains and The Bighorn National Forest. I had planned to just drive though, up and over, on my way to Yellowstone, but I ended up stopping here for quite a while. The Bighorns aren’t as spectacular as Yellowstone or some of the other parks, but it’s a hell of a lot less crowded. I’d go back and spend a few days here easy.
Surprisingly, despite spending 57 hours in the car, I was not bored a single minute of my trip. I marveled at the landscape, played music, and thought. I thought a lot. I expected to listen to a bunch of audiobooks but only managed to finish one I was most of the way through and the first third of another…the landscape was just too distracting most of the time. My experience leads me to believe I might be a good candidate for a solo Mars mission (aside from the one-way thing).
Animals seen on my trip, a partial list: rabbits, prairie dogs, antelope, ducks, geese, pelicans, pheasants, a moose, a wolf, elk, bison, deer, and a bunch of birds I couldn’t identify. The prairie dogs sat near their holes peeping at each other…it was really cute. The moose was a juvenile male in Yellowstone who looked lost & confused; he trotted alongside the road for a bit, then swam across the river and took off into the woods. I was apprehensive about not seeing a bison on my trip, but I shouldn’t have worried…Yellowstone was lousy with ‘em. Pro tip: bring a good pair of binoculars, possibly left over from eclipse-watching.
Yellowstone was one of the highlights (with a caveat that I’ll get to in a second). A single park containing all these different landscapes, from volcanic wastelands to mountain peaks to verdant river valleys to evergreen forests to grasslands…it’s a geographic marvel. But here’s the but: it’s also really crowded in the summer. At times, it felt like a nature mall, with herds of consumers moving from the bison shop to the geyser store. Reminded me a bit of my experience at the Louvre, itself a wonderful place too crowded to enjoy.
Final roadtrip stats: 2748 miles driven in 10 days and a total of 57 hours in the car. 718 photos and videos taken. I visited seven states — Iowa, Nebraska, South Dakota, Wyoming, Montana, Idaho, and Oregon — and spent at least one night in each save Idaho. Lowest point: 810’. Highest point: 11,070’.
Somewhere west of the Missouri River, which separates Iowa & Missouri from Nebraska & Kansas, the dominance in the eastern US of human activity & organization gives way to geology and geography. Even in the sparser areas of the Midwest, you look down from an airplane and see the Jefferson grid: square parcels of land, each with a group of buildings contained somewhere within it. Further west, hills and mountains and volcanoes and rivers and streams and forests and plains dominate the landscape and how people move within it. The West is not yet tamed, not by a long shot, and acknowledging this goes a long way toward understanding the people who live here.
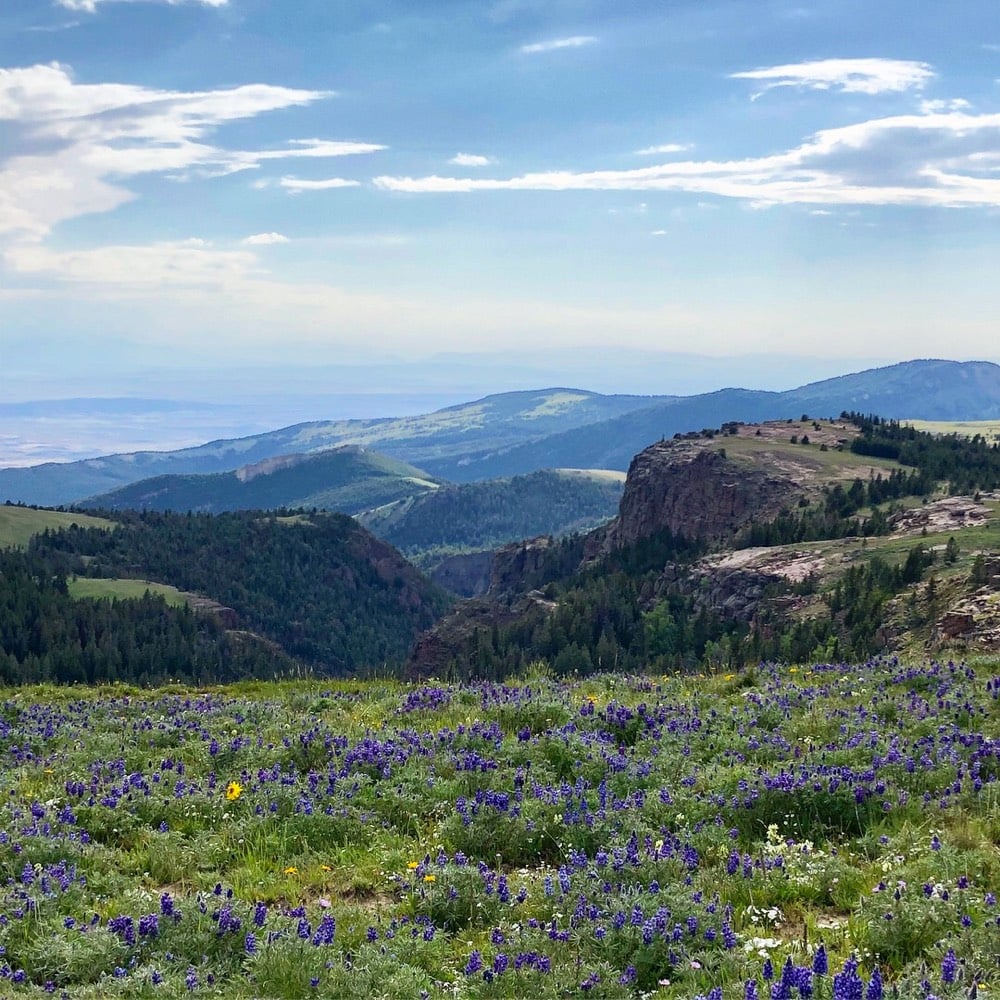
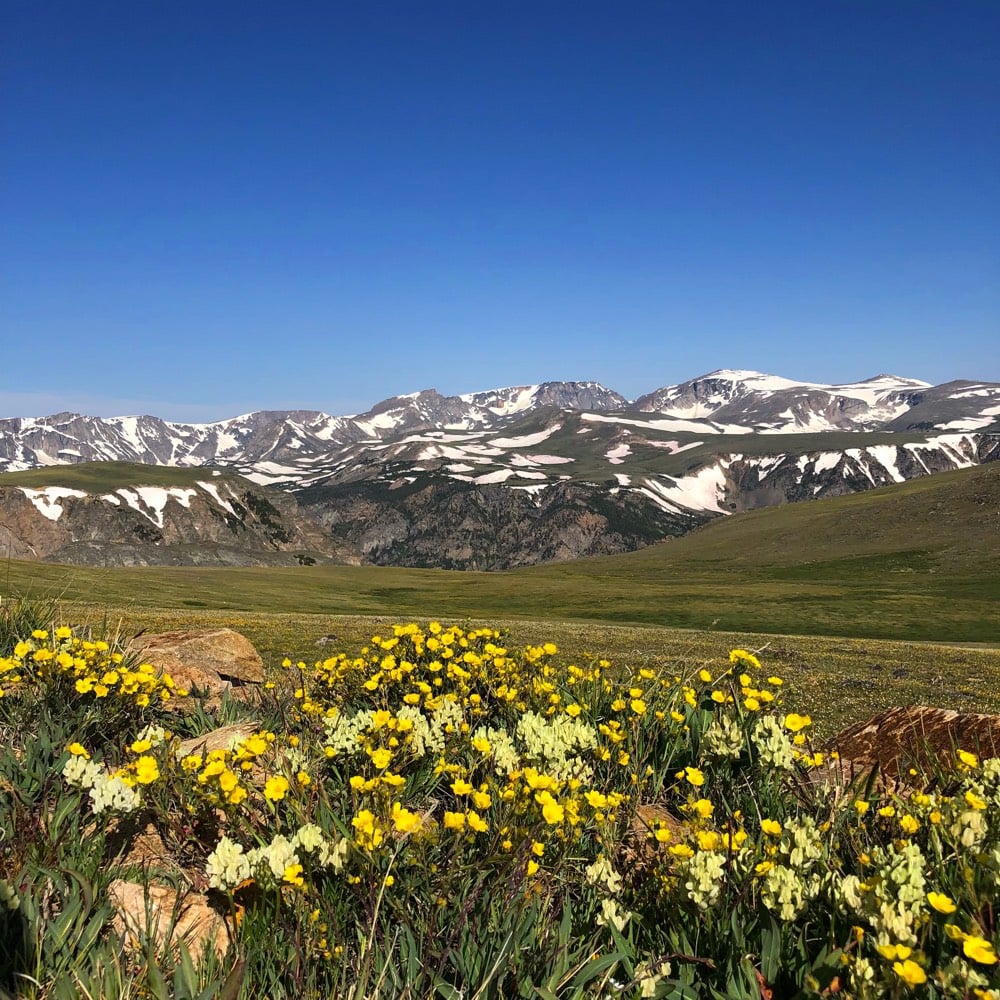
Biggest surprise of the trip, part 2: High altitude wildflower meadows. When I stopped my car at a scenic overlook at 9400’ in the Bighorn Mountains and saw a path down a gentle slope through a meadow of wildflowers growing very close to the ground, I didn’t think a whole lot about it. Pretty scene, right? I grabbed my daypack from the car and as soon as I stepped down onto the path and into the meadow, this amazing smell sent me reeling. For 20 minutes, I walked in an olfactory daze to the crest of the next hill and back. OMG, what an amazing sensation…a definite high-water mark.
The speed limit on the freeways in South Dakota, Wyoming, Montana, and Idaho was 80 mph. On some rural undivided two-lane highways, the limit was still 70 mph, which I found astounding. But the lanes and the shoulders were way wider than in Vermont, the roads flatter and straighter, and traffic was few and far between most of the time. Still, even just that little extra speed really cuts down on drivers’ potential reaction times.
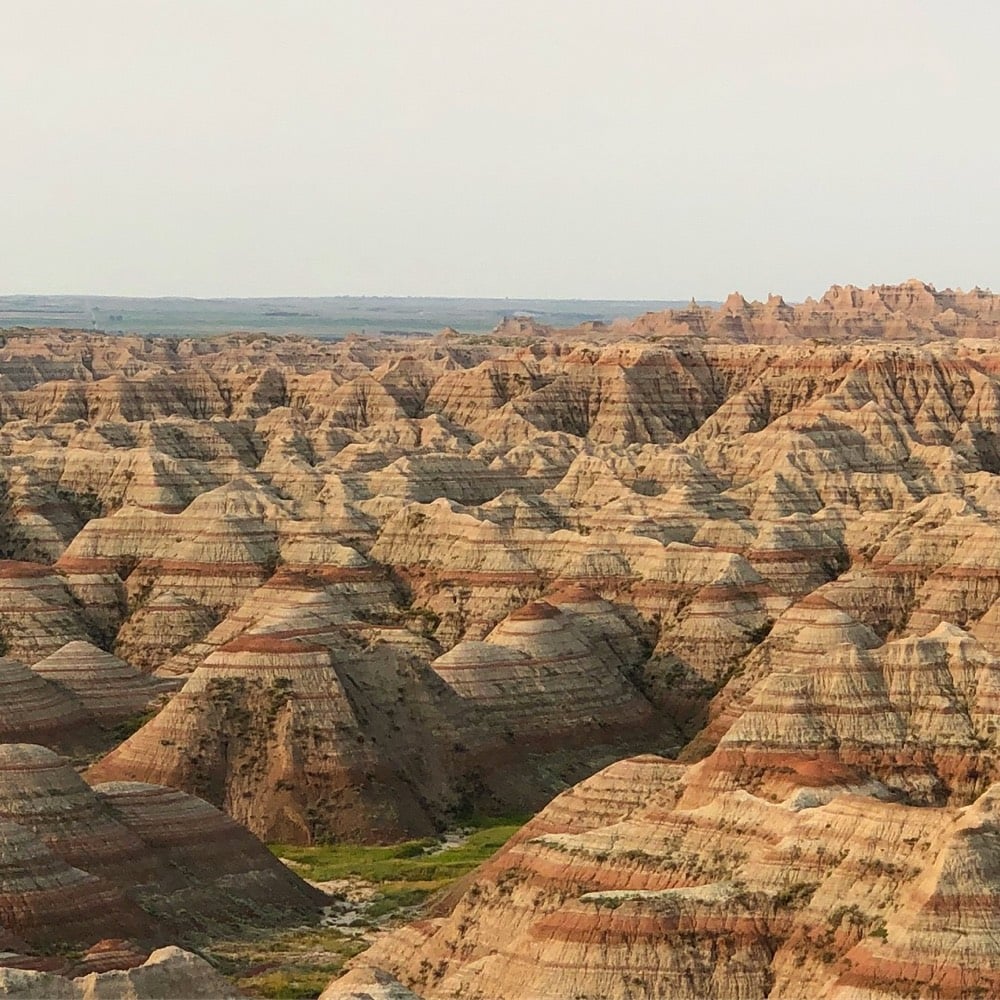
I had high hopes for the Badlands, and it lived up to the hype. Magnificent desolation, accessible, and not super crowded. I could (and probably should) have spent a couple of days there easy.
Food was not a highlight or a focus of this trip, mostly because I didn’t spend a tremendous amount of time seeking out good places to eat. I had some Thai lettuce wraps w/ bison in SD that were pretty good, some just-fine sushi in Missoula, and a delicious tostada scramble in Rhododendron, OR. Maybe the best thing I ate was a homemade breakfast burrito I bought at a gas station in Red Lodge, Montana. It was a struggle to find non-meat things to eat — I’m not a vegetarian, but man cannot subsist on burgers & hot dogs & steaks & BBQ for a week and a half w/o GI discomfort. With some notable exceptions, food in the US is more homogenous than ever…you can get anything almost anywhere.
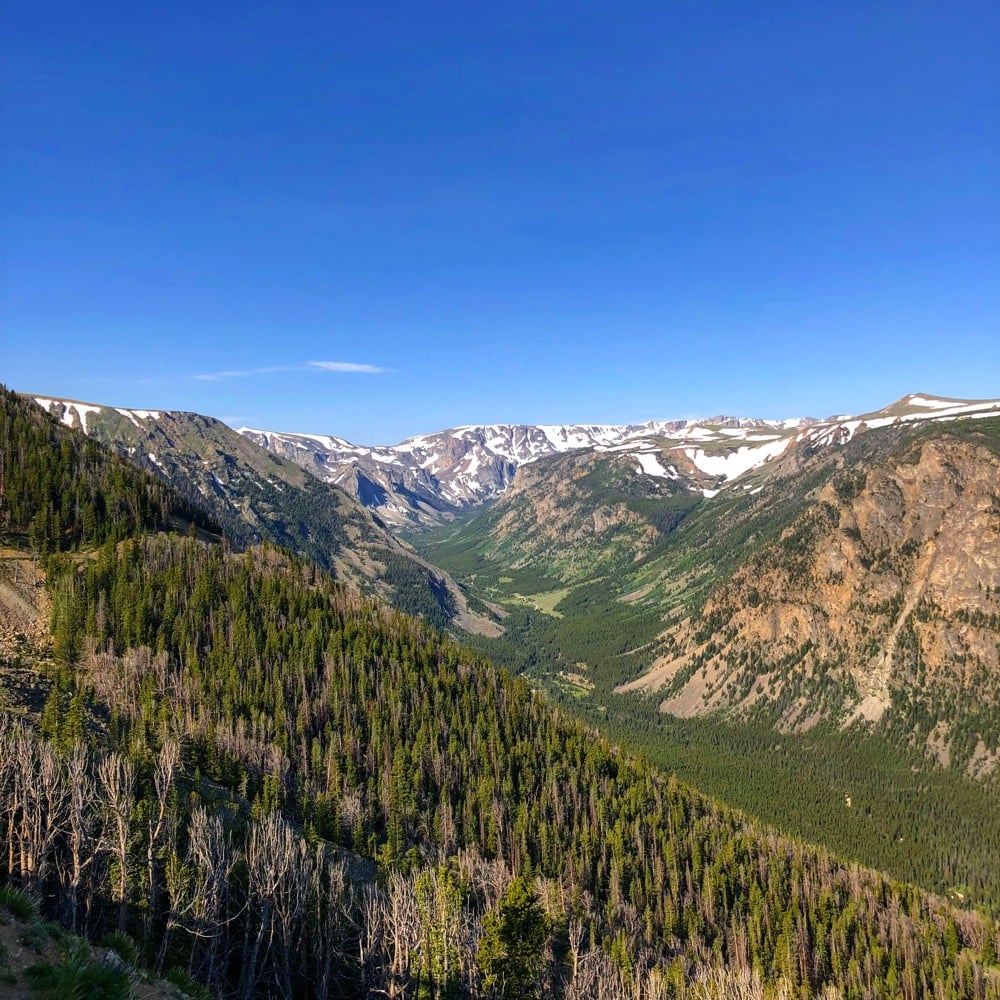
Biggest surprise of the trip, part 3: The hosts at the B&B I stayed at in Wyoming advised me to enter Yellowstone via the Beartooth Highway and I am so glad I took their advice. The 68-mile drive was called “the most beautiful drive in America” by former CBS correspondant Charles Kuralt and he might be right. At the top of the pass, you drive just short of 11,000’ above sea level; I climbed above the 11K mark for a stunning 360° view of the entire area. Reader, I may have done the arms-wide-on-the-bow-of-the-Titanic gesture on top of a rock at the top of the world…no apologies.
About 5 minutes after I checked into my B&B near Cody, WY, I looked out my window to see a rain cloud off in the distance with a rainbow coming out of it. Chuckling, I asked my host if that was a common occurence around here. “Pretty much,” he replied, “especially with climate change.” A life-long resident of the area, he went on to explain that it rains a lot more there now than “20-30 years ago”. “See all that grass out there? It’s supposed to be brown this time of year.”
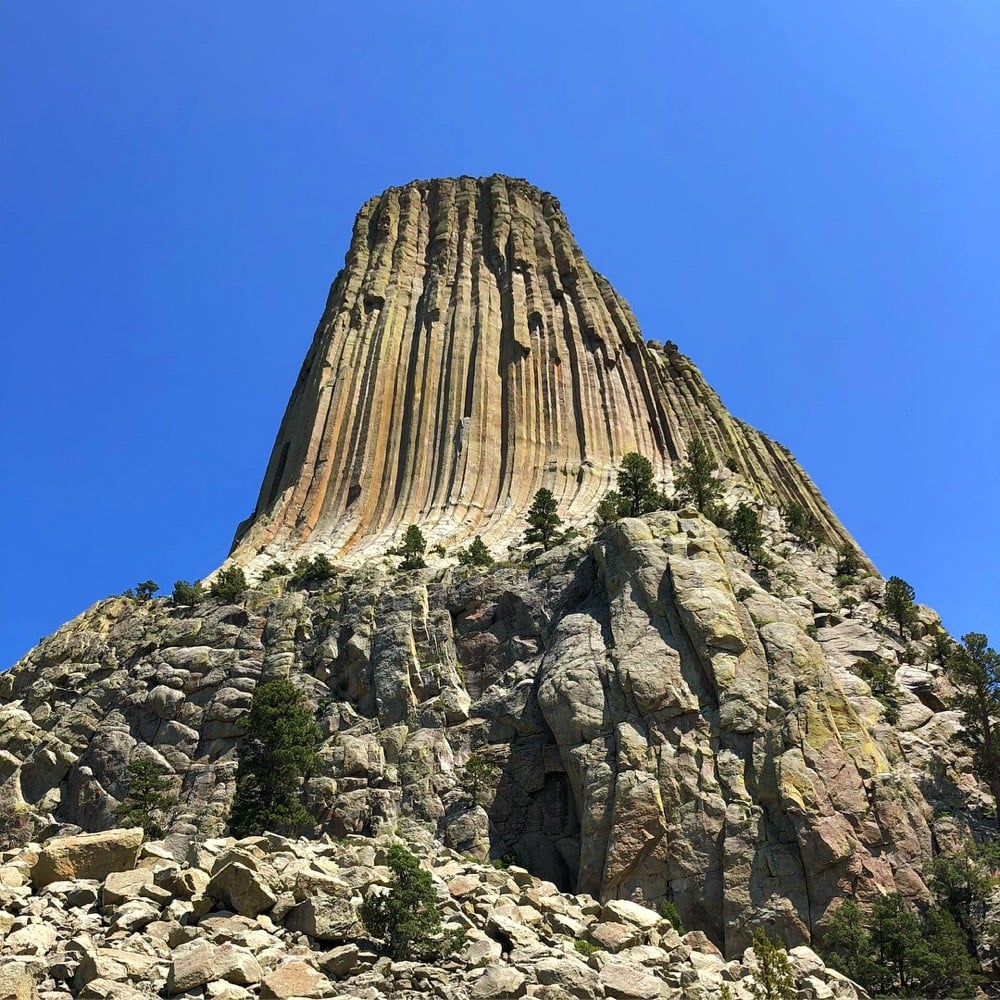
Several people told me before my trip that Devils Tower was worth the effort, but as I spotted it off in the distance on my approach, I had my doubts. But as it got closer, I realized they’d all been right. Totally crazy geological thing worth seeing in the flesh.
At a gas station in southern South Dakota, a man noticed the Texas plates on my rental car and asked, “What’s the price of gas in Texas these days?” I explained my situation, and he said, “I’m from Texas originally and I can tell by your accent that you ain’t. What’re ya doing in this godforsaken country?”
In Wyoming, I stayed less than a mile from the Heart Mountain Relocation Center, a WWII Japanese American confinement site. From 1942 to 1945, this concentration camp held almost 14,000 people, making it the third-largest town in Wyoming at the time. The majority were American citizens and had done nothing wrong and committed no crimes…they were put there for being of Japanese heritage. I regret that my plans didn’t allow for a visit; if I’d had known beforehand that it was going to be so close, I would have made the time, given our present administration’s treatment of its Muslim citizens and asylum seekers from Central and South America. As Faulkner said, “The past is never dead. It’s not even past.”
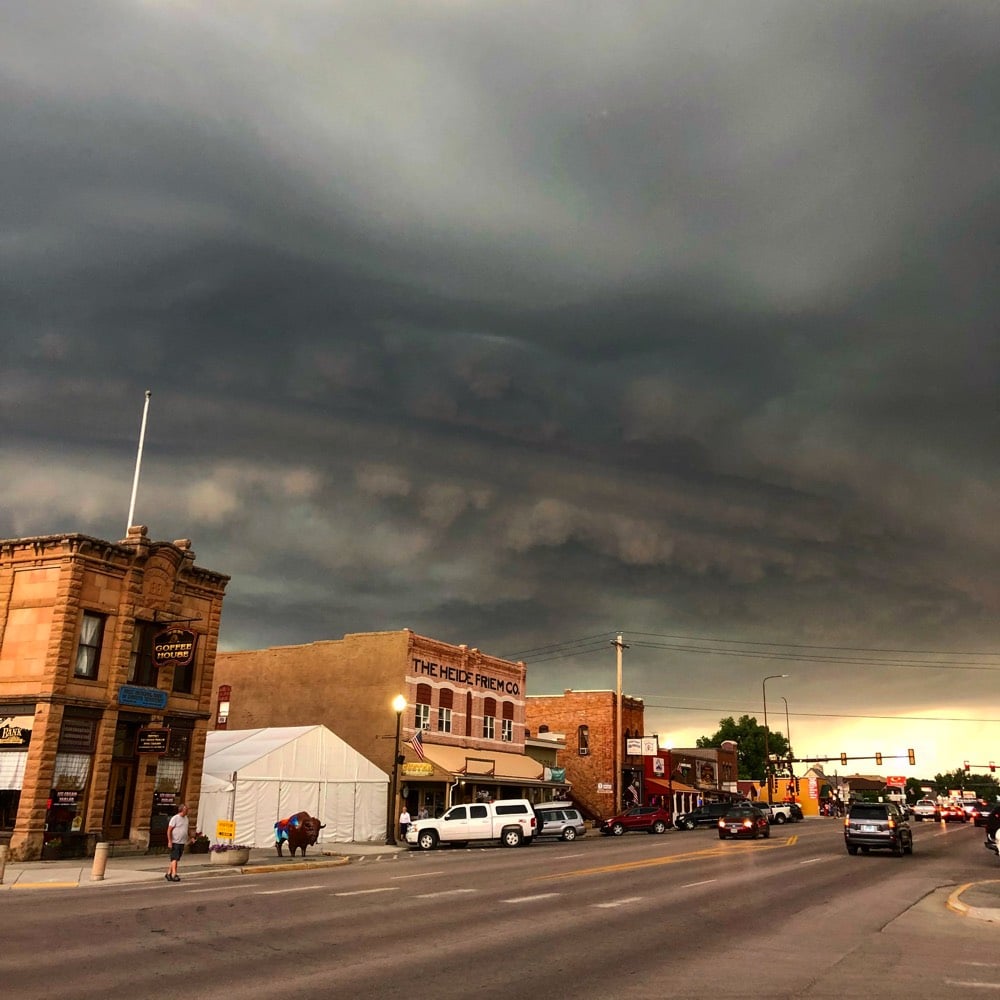
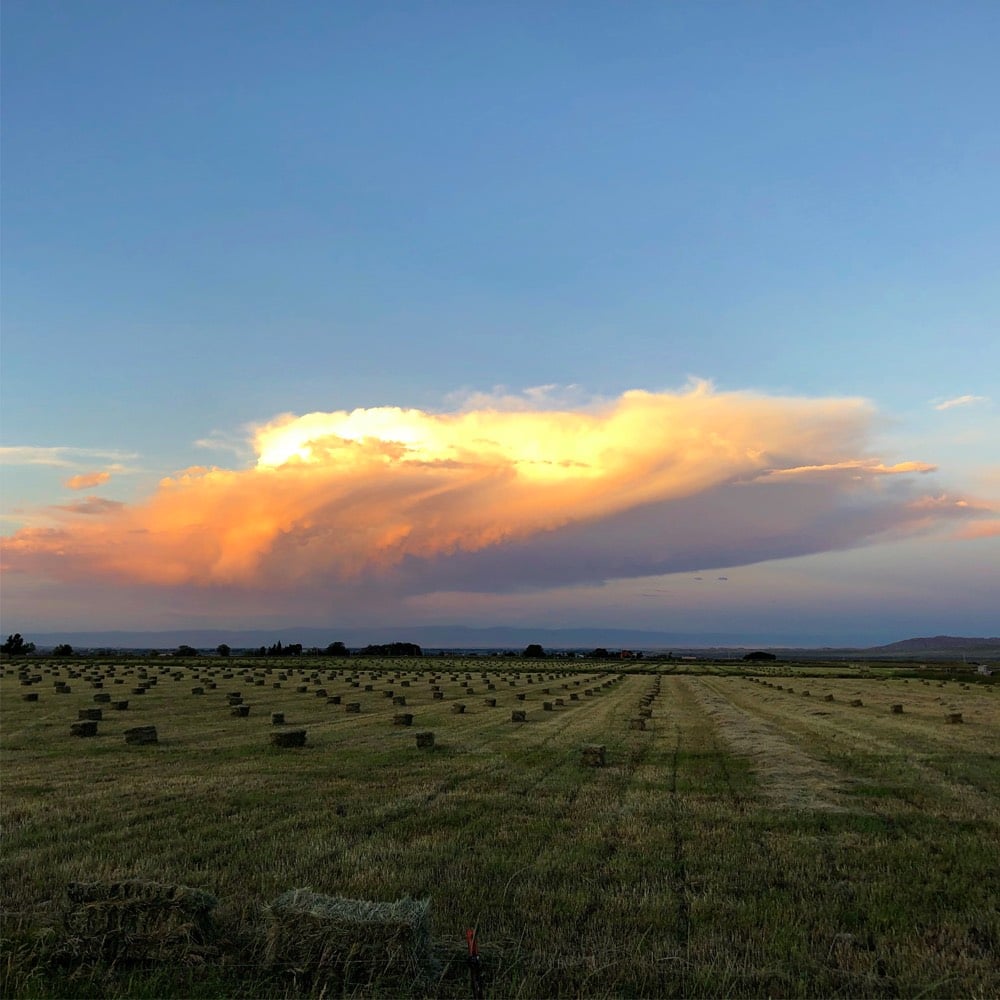
I saw some cool thunderstorms:
If I had a time machine, I would tell myself from two weeks ago to skip Mt Rushmore, Wind Cave, and the volcanic stuff in Yellowstone. And perhaps Wall Drug. I also would have opted to fly out of Salt Lake City instead of Portland, OR to give me more time to explore Montana and Wyoming…the trip ended up having too much driving and not enough being out in nature.
You can see more photos from my trip on Instagram and in this saved Instagram Story. I feel very lucky to have had the time and resources to take this trip. It definitely took me out of my comfort zone in both good ways and bad — the journey definitely wasn’t all sunshine and lollipops, despite what my photos might indicate. To many of us, it seems like a perilous time in our nation’s history, with many debts, old and new, coming due in rapid-fire succession. Doing this roadtrip reminded me of many great things about this country & the people who live in it and gave me the time & space to ponder how I fit into the puzzle, without the din of the news and social media. If you can manage it, I encourage you all to do the same, even if it’s just visiting someplace close that you’ve never been to: get out there and see the world and visit with its people. This world is all we have, and the more we see of it, the better we can make it.

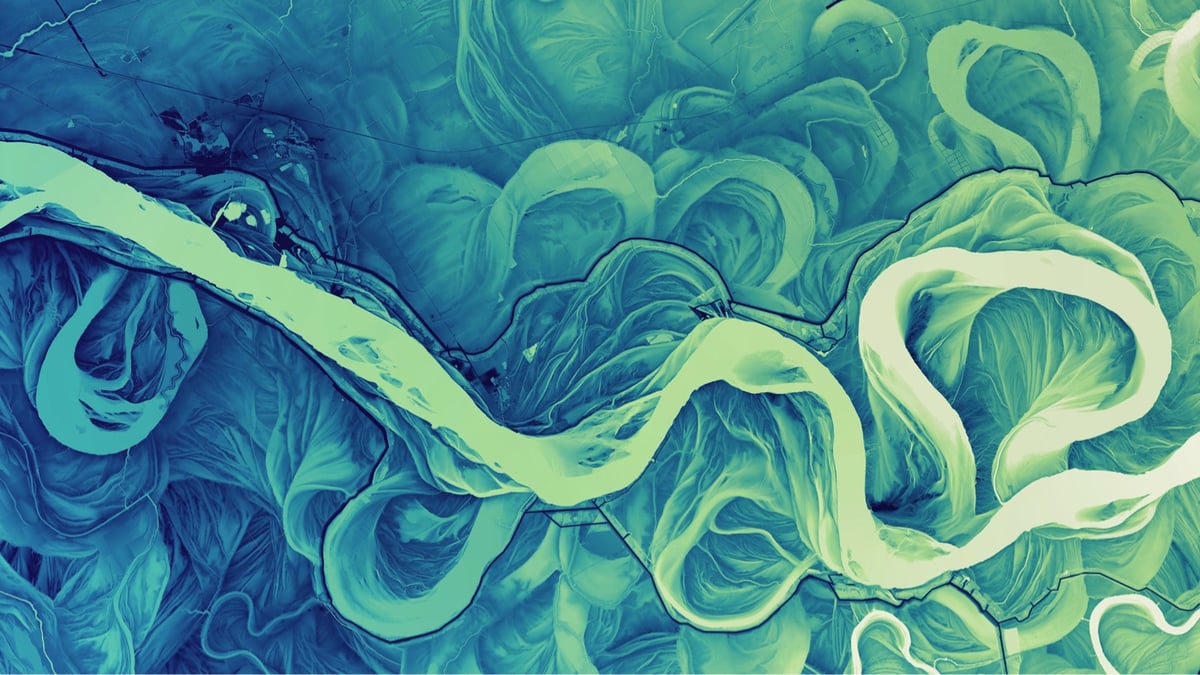
The Washington State Geological Survey is using LIDAR technology to study the geology of the land hidden under forested areas of the state. LIDAR is like radar, but instead of bouncing radio waves off of objects to detect their distances, you use lasers. When you shoot laser light at a forested area, most of it is reflected back by the trees. But some of it reaches the ground, so by measuring the light that’s reflected back from the lowest point, you get a very accurate map of the bare earth, sans nature. Using the LIDAR maps, they can study the course changes in rivers, landslides, volcanic lava flows, earthquake faults & fault zones, tsunami inundation zones, and glaciers.
The beautiful photo at the top is a LIDAR image of the Sauk River and all its current and former channels…the bluish tint makes it look like an x-ray, which it pretty much is. It also reminds me of the meander maps of the Mississippi River made by Harold Fisk for the US Army Corps of Engineers.
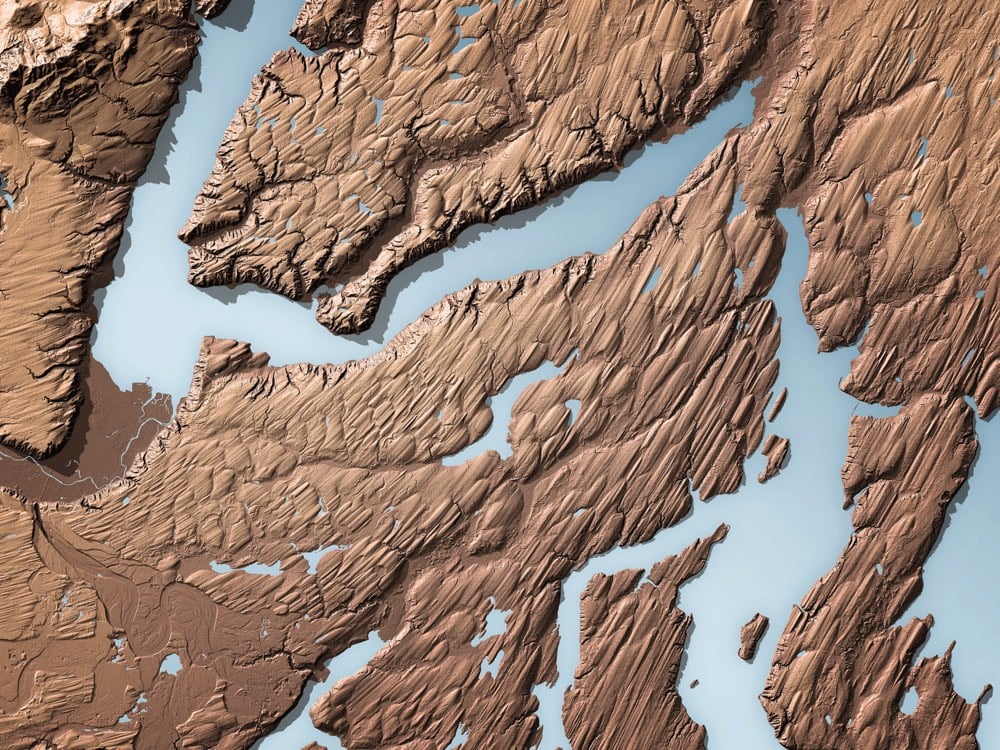
Here are two images of Bainbridge Island:
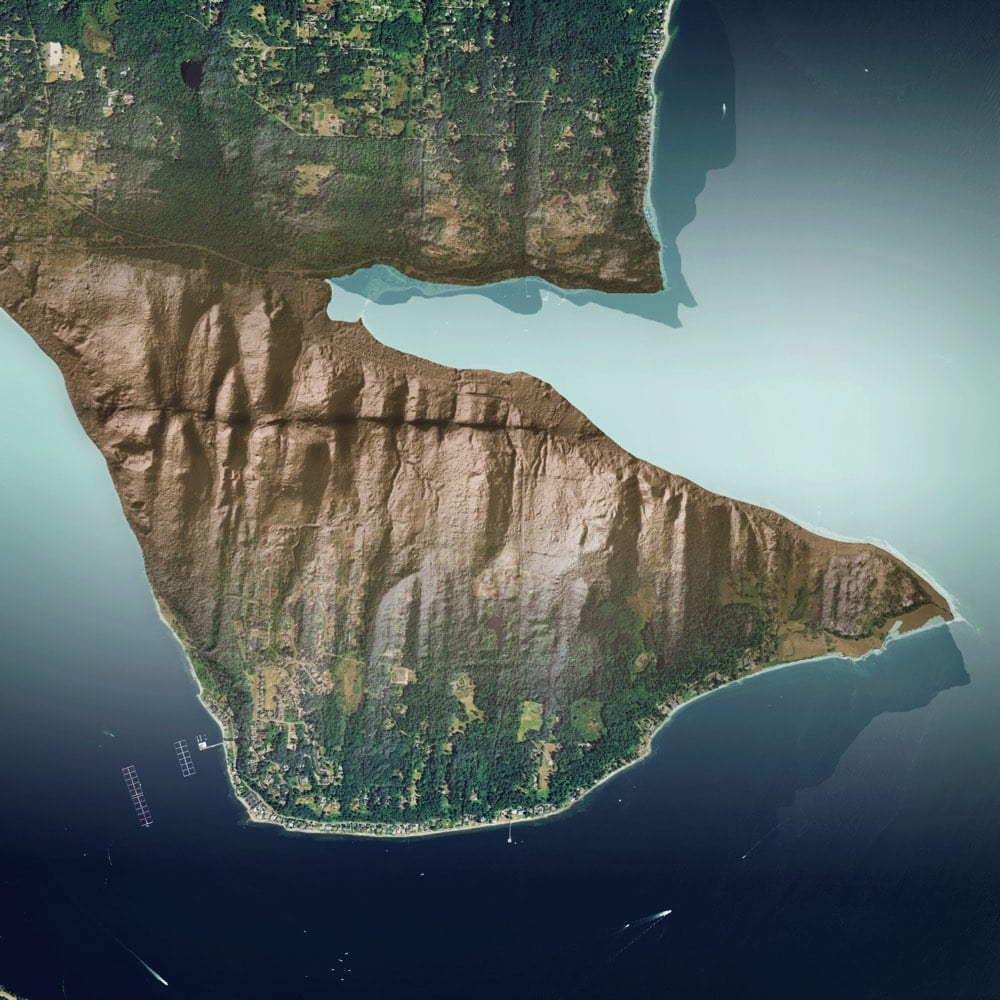
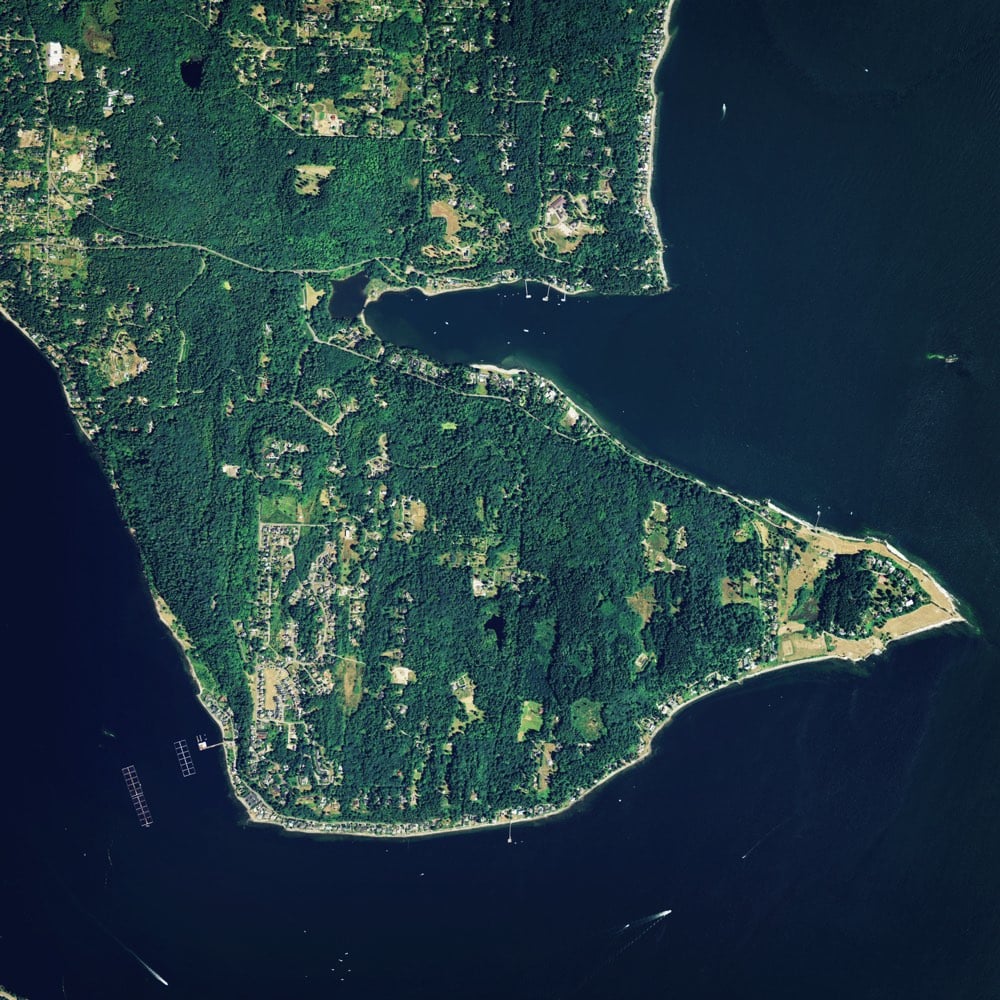
The LIDAR image clearly shows a horizontal earthquake fault scarp that’s completely hidden by the ground cover.
These two images are of drumlins left behind by a glacier:
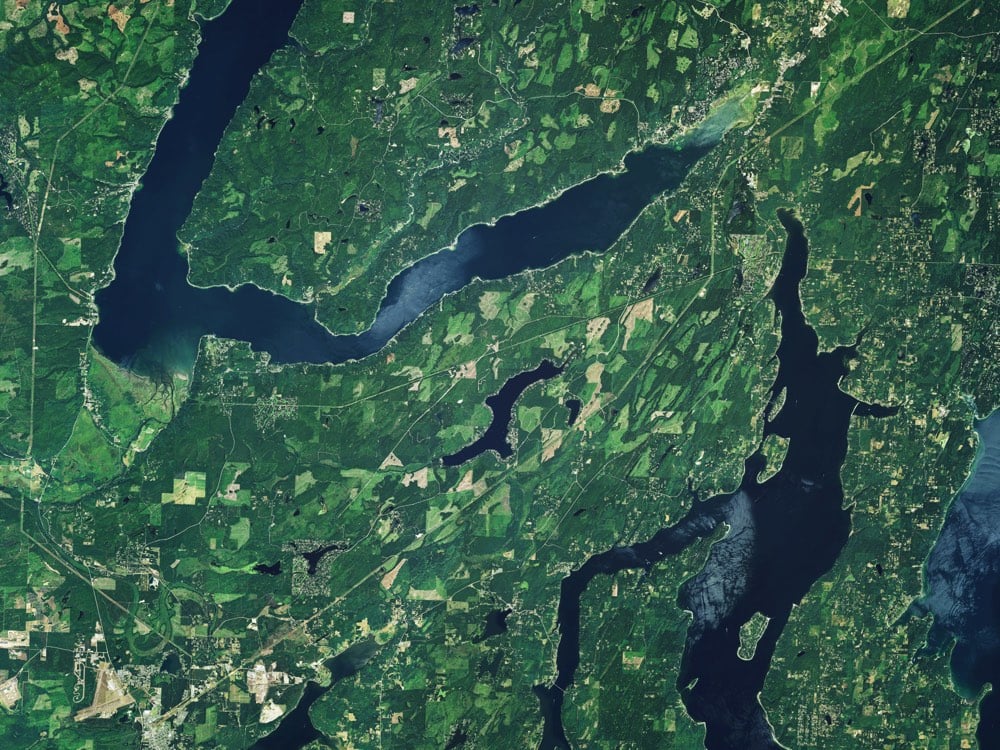
Again, the LIDAR image shows the movement of a long-gone glacier with stunning clarity compared to the satellite photo with ground cover.
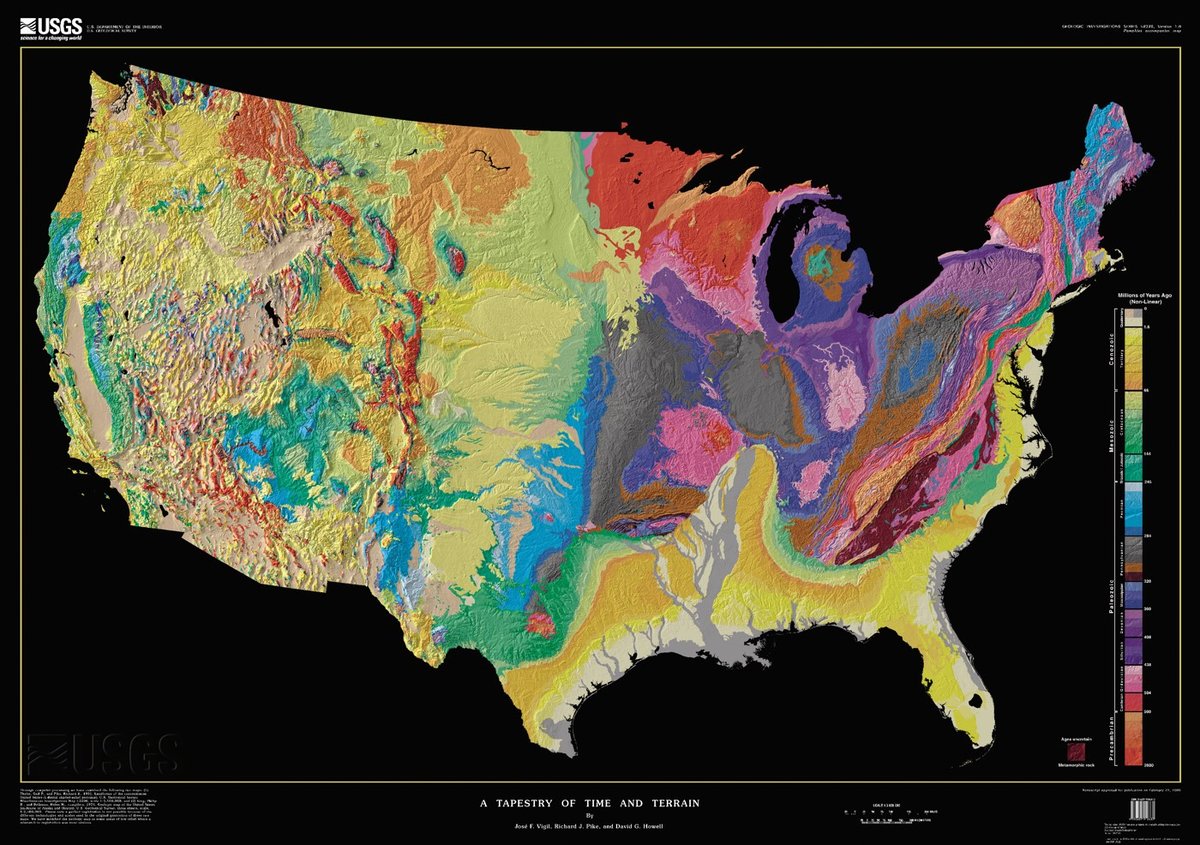
A Tapestry of Time and Terrain is a map from the USGS that shows the topology and ages of rock underneath the surface of the United States. The age scale on the right is difficult to read unless you download the full 45Mb PDF version, but it goes from Precambrian (2.6 billion years ago) at the bottom to more-or-less the present day at the top.
Through computer processing and enhancement, we have brought together two existing images of the lower 48 states of the United States (U.S.) into a single digital tapestry. Woven into the fabric of this new map are data from previous U.S. Geological Survey (USGS) maps that depict the topography and geology of the United States in separate formats. The resulting composite is the most detailed and accurate portrait of the U.S. land surface and the ages of its underlying rock formations yet displayed in the same image. The new map resembles traditional 3-D perspective drawings of landscapes with the addition of a fourth dimension, geologic time, which is shown in color. This union of topographic texture with the patterns defined by units of geologic time creates a visual synthesis that has escaped most prior attempts to combine shaded relief with a second characteristic shown by color, commonly height above sea level (already implicit in the shaded relief). In mutually enhancing the landscape and its underlying temporal structure, this digital tapestry outlines the geologic story of continental collision and break-up, mountain-building, river erosion and deposition, ice-cap glaciation, volcanism, and other events and processes that have shaped the region over the last 2.6 billion years.
(via @robgmacfarlane)
Vox’s Joss Fong assembles a scale model of Stonehenge and explains some of the ancient monument’s geometry, the geology of the stone it’s built from, and the its possible astronomical significance.
Stonehenge is a popular destination for summer solstice celebrations because the 5,000-year-old monument points toward the summer solstice sunrise on the horizon. However, it also points to the winter solstice sunset in the opposite direction and there’s good reason to believe that this may have been the more important alignment for the Neolithic people who built Stonehenge. We investigate by constructing a tiny model of the Stonehenge monument.

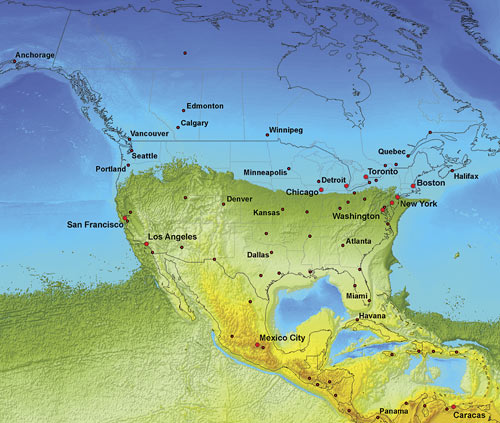
That’s a portion of the 2012 US Presidential election map of the southern states broken down by county: blue ones went Barack Obama’s way and counties in red voted for Mitt Romney.
But let’s go back to the Cretaceous Period, which lasted from 145 million years ago to 65 million years ago. Back then, the coastline of what is now North America looked like this:
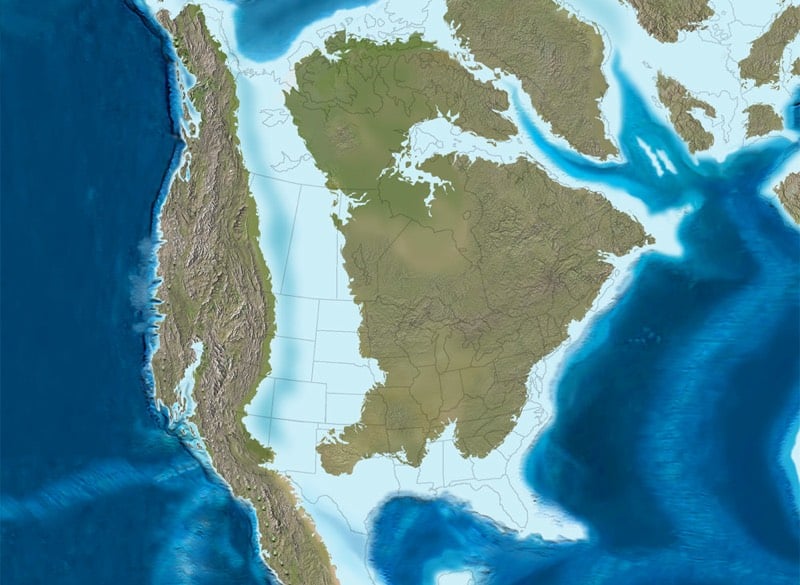
Along that ancient coastline of a shallow sea, plankton with carbonate skeletons lived and died in massive numbers, accumulating into large chalk formations on the bottom of the sea. When the sea level dropped and the sea drained through the porous chalk, rich bands of soil were left right along the former coastline. When that area was settled and farmed in the 19th century, that rich soil was perfect for growing cotton. And cotton production was particularly profitable, so enslaved people were heavily used in those areas.
McClain, quoting from Booker T. Washington’s autobiography, Up From Slavery, points out: “The part of the country possessing this thick, dark and naturally rich soil was, of course, the part of the South where the slaves were most profitable, and consequently they were taken there in the largest numbers.” After the Civil War, a lot of former slaves stayed on this land, and while many migrated North, their families are still there.
The counties in which slave populations were highest before the Civil War are still home to large African American populations, which tend to vote for Democratic presidential candidates, even as the whiter counties around them vote for Republicans. The voting pattern of those counties on the map follows the Cretaceous coastline of 100 million years ago — the plankton fell, the cotton grew, the enslaved people bled into that rich soil, and their descendants later helped a black man reach the White House.
Jller is a machine that sorts stones from a specific river according to their geologic age.
The machine works with a computer vision system that processes the images of the stones and maps each of its location on the platform throughout the ordering process. The information extracted from each stone are dominant color, color composition, and histograms of structural features such as lines, layers, patterns, grain, and surface texture. This data is used to assign the stones into predefined categories.
See also the robotic pancake sorter. (via colossal)
Here’s everything you need to know about the Earth, in a snappy 7-minute video. I am trying very hard not to watch the rest of Kurzgesagt’s videos this afternoon, but I did make time for this one on the Big Bang — key quote: “time itself becomes wibbly wobbly” — and how evolution works.
A beautifully shot short film about mountains, how they form, how they age, and how they die.
Volcanoes “scream” before they erupt. And they also have a heartbeat of sorts. Listen to these surprisingly intense sounds emitted by a volcano in Alaska before it erupted. The first recording condenses 10 minutes of audio into 10 seconds, so you can hear the pre-eruption scream:
The second recording is of 10 hours of pre-eruption mini earthquakes condensed into one minute of audio.
The pause right before the eruption is Mother Nature dropping the beat. (via @DavidGrann)
This is an Icelandic waterfall called Litlanesfoss and the naturally occurring rock formation is columnar jointed basalt.
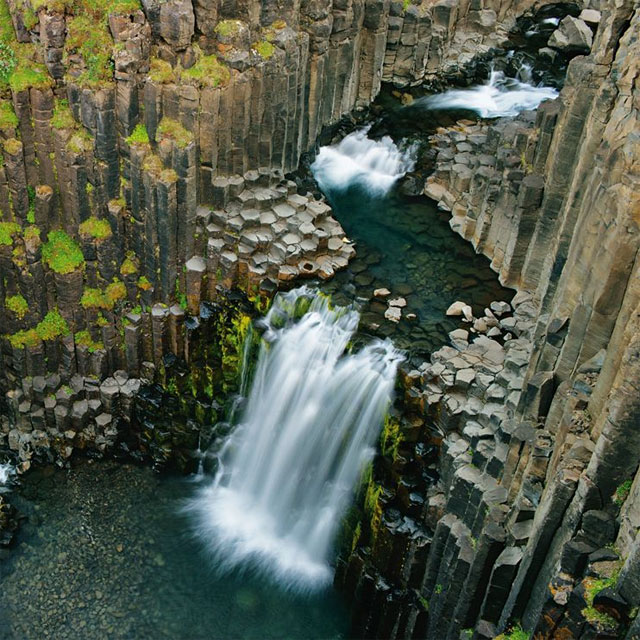
The columns form due to stress as the lava cools. The lava contracts as it cools, forming cracks. Once the crack develops it continues to grow. The growth is perpendicular to the surface of the flow. Entablature is probably the result of cooling caused by fresh lava being covered by water. The flood basalts probably damned rivers. When the rivers returned the water seeped down the cracks in the cooling lava and caused rapid cooling from the surface downward. The division of colonnade and entablature is the result of slow cooling from the base upward and rapid cooling from the top downward.
One of the coolest things I have ever seen. Looks totally fake, like they built it for Fractal Falls in Polygon Gorge at Disneyland or something. Giants Causeway in Northern Ireland looks amazing as well. Check out several similar formations from around the world.
Danxia refers to a “type of petrographic geomorphology” found in China. What that means is you get these mountains that look as though they were decorated with crayons by a five-year-old channelling Dalí.
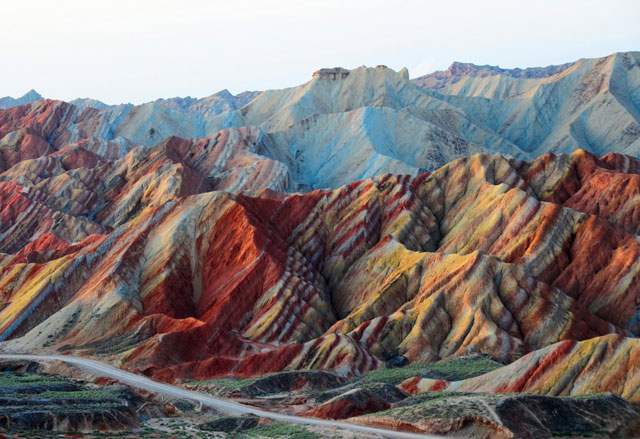
That shot was taken by Melinda ^..^ on Flickr…you can find dozens of her Danxia photos here. A kottke.org reader suggests that Tiny Wings creator Andreas Illiger was influenced by the Danxia landforms in developing the iconic scenery for the game.

Not a bad theory. (thx, christopher)
Using computer modeling, it’s possible to take a crack at answering that question.
If the earth stood still, the oceans would gradually migrate toward the poles and cause land in the equatorial region to emerge. This would eventually result in a huge equatorial megacontinent and two large polar oceans.
Five million years ago, a flood filled the Mediterranean Sea in only two years.
In a period ranging from a few months to two years, the scientists say that 90% of the water was transferred into the basin. “This extremely abrupt flood may have involved peak rates of sea level rise in the Mediterranean of more than 10m per day,” he and his colleagues wrote in the Nature paper.
BLDGBLOG has a fascinating interview with geoscientist Abraham Van Luik about how to confine nuclear waste for 1,000,000 years at the Yucca Mountain nuclear waste repository in Nevada. One of the problems is keeping people away from the site in the far future:
We have looked very closely at what WIPP is doing — the Waste Isolation Pilot Plant in New Mexico. They did a study with futurists and other people-sociologists and language specialists. They decided to come up with markers in seven languages, basically like a Rosetta Stone, with the idea that there will always be someone in the world who studies ancient languages, even 10,000 years from now, someone who will be able to resurrect what the meanings of these stelae are. They will basically say, “This is not a place of honor, don’t dig here, this is not good material,” etc.
Older posts
Socials & More