kottke.org posts about weather
Throughout most of human history, the weather has resisted humanity’s desire to change it.
For thousands of years, we have sacrificed children, sung songs and danced, brewed alchemical concoctions, chanted prayers, fired cannons, and made many other futile efforts in the attempt to somehow change the weather a little more to our liking.
And then, with the Industrial Revolution, all that changed. Humans modified the weather on a planet-wide, unpredictable scale.
Climate change is an enormous accomplishment. From an engineering perspective, the ability to coordinate activities to modify the average temperatures of an entire planet, change the pH of deep oceans, and cause vast shifts in the distribution of arable land across continents is a realization of powers as considerable as anything humanity has achieved before. It rewrites the core story of our origins, in which we are powerless before the forces that have made us. The fact that this discovery of our powers—that we can modify the weather on a planetary scale—was more or less accidental only puts it more firmly in the canon of scientific revelations. We are also, as with our other emergent powers, quite apparently terrible at it.
The innumerable crises prompted by our moment—the desertification of arable land, increasingly catastrophic storms, the deadly rise in temperatures in previously habitable regions—are nothing if not urgent incentives to grasp hold of what we have already done. After millennia of reaching up toward the sky, the levers just out of reach, the consensus on climate change indicates that we are, in fact, already manipulating the weather every day.
All of which suggests a new question: Are we ever going to get good at it?
The rest of the piece is about efforts to “get good at” weather modification. (via longreads)
Water World, created by Seán Doran from imagery captured by a NASA/NOAA weather satellite, is a gorgeous, swirling, painterly portrait of the Earth’s dynamic atmosphere. Doran calls it “a meditative slow gaze at Earth’s atmosphere, revealing the hidden depths of activity in the water-filled skies of planet Earth”. It’s 4K, so put it on the biggest screen you can find and just sit back and watch.
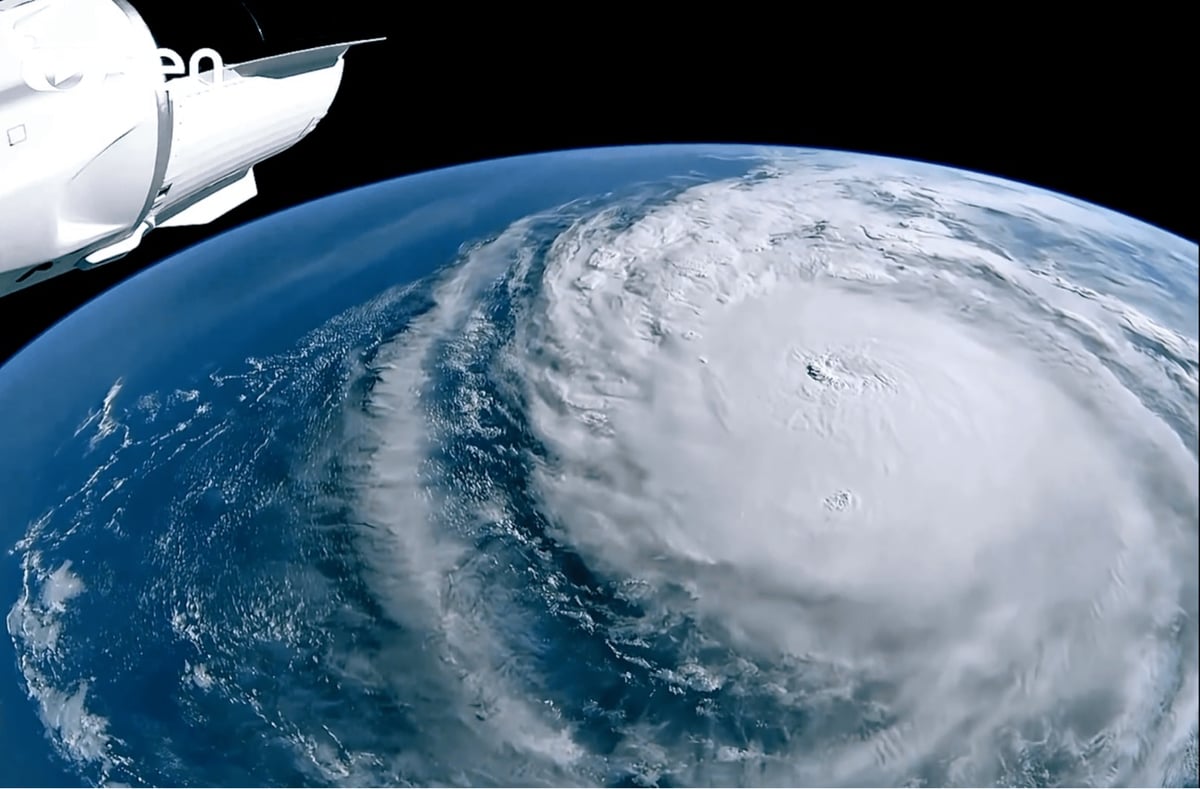
Seán Doran, who I’ve featured here many times before for his remastered astronomy photos & videos, has taken photographs captured by a Japanese weather satellite of Typhoon Sinlaku in April 2026 and “repaired, remastered and transformed” the images into this breathtaking 4K video.
The beauty of the storm as seen from above belies its fury and destructiveness. Sinlaku was the “strongest tropical cyclone in the Northern Hemisphere” since 2021 and the strongest overall storm so far in 2026. The Mariana Islands, Guam, and Micronesia all suffered widespread damage and the storm has claimed 17 lives so far.
I went into this video not knowing anything about how a mid-19th century sunshine recorder might work and was genuinely delighted by the reveal. If you’d like to be similarly surprised, stop reading now and just watch the video.
…
…
The sunshine recorder was invented in 1853 for measuring the duration of bright sunshine over a day. The contraption consists of a solid glass ball that acts as a lens, which focuses the light of the Sun onto a paper recording card, burning marks into it. As the Sun moves across the sky, the focus point moves across the recording card, burning a line into it. If it’s super sunny out, the focused beam burns right through the card. So simple! So clever! And so straightforwardly physical — here’s what a daily sunshine record looks like:


(via robert stephens)
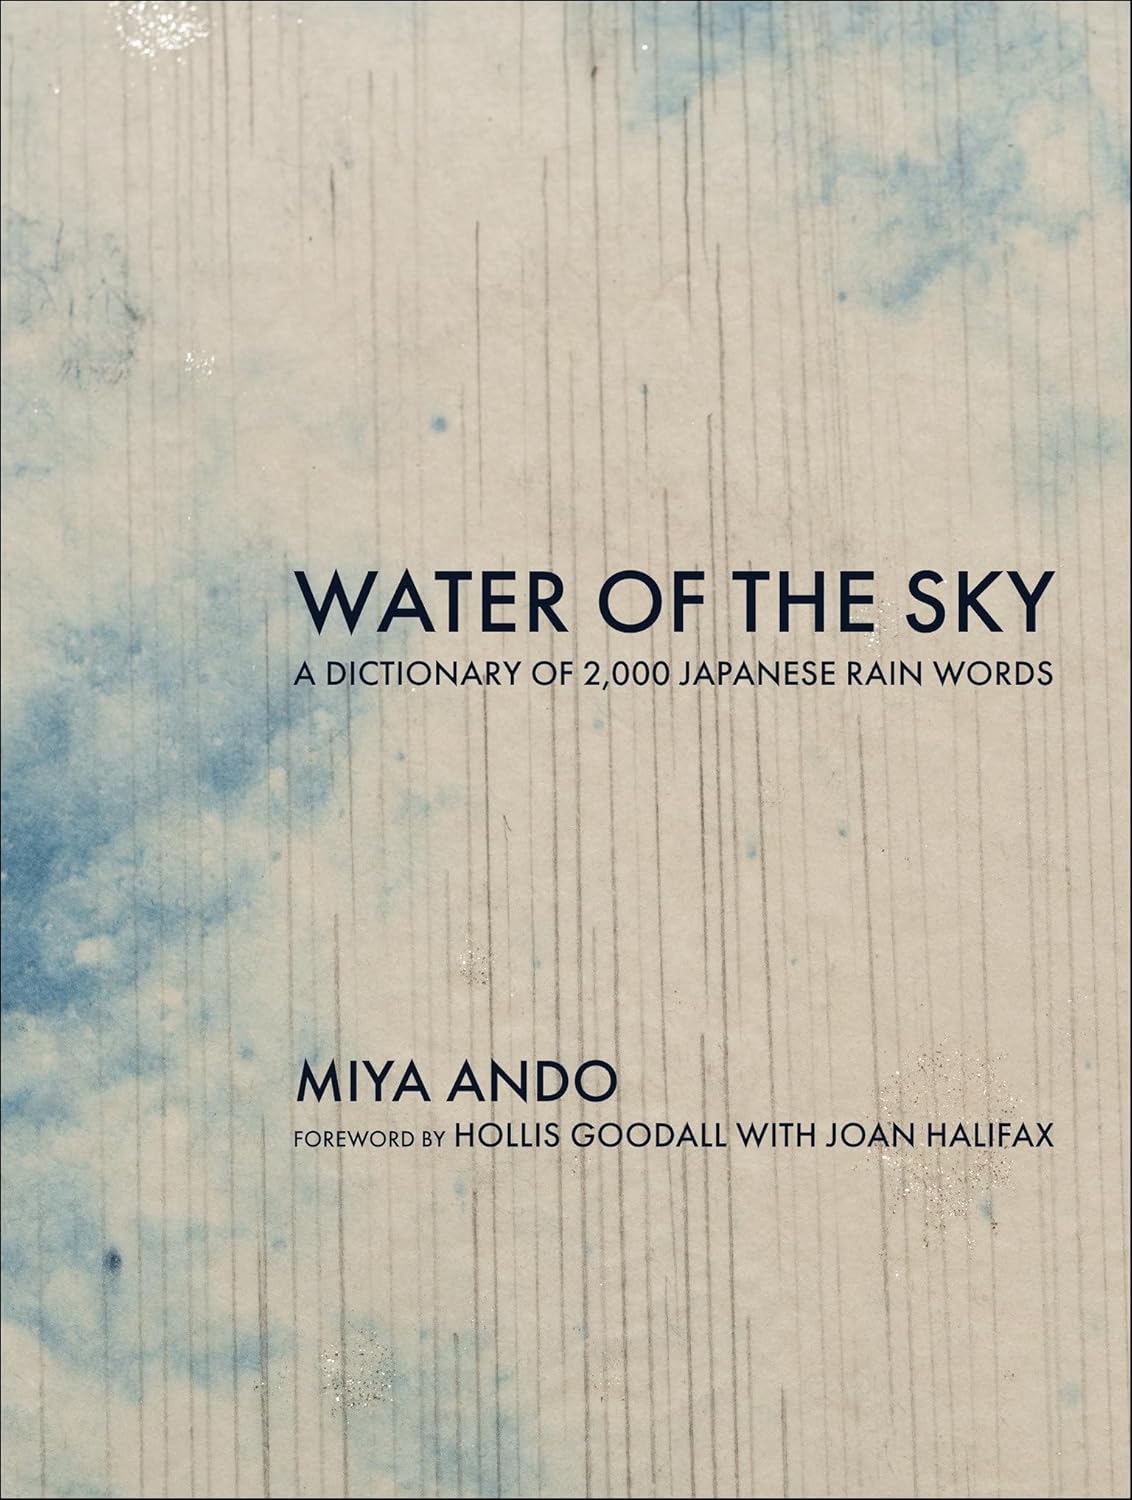
From artist Miya Ando, Water of the Sky, A Dictionary of 2,000 Japanese Rain Words.
Through a collection of 2,000 Japanese words, their English interpretations, and 100 drawings, Ando describes the breadth and diversity of rain’s many expressions: when it falls, how it falls, and how its observer might be transformed physically or emotionally by its presence.
I paged through this at a bookstore recently; it is delightful. From an excerpt of the book, here are a few of Ando’s rain words & phrases:
Tokidoki Niwaka Ame: Sometimes light snow and rain showers
Ama ga Nukeru: The skies open up, it rains like cats and dogs
Shinotsukuame: Intense rain that falls heavily, is very fine and strong like the Bamboo Grove at Shinotake
Giu: False rain
Amadoi: Sliding red beans to resemble the sound of rain
Kōu: Rain that comes exactly when you were waiting for it
Water of the Sky is available at Bookshop, Amazon, and wherever books are sold.
In Florida, flooding is a huge cause of death and destruction from hurricanes. This video looks at how a town called Babcock Ranch was designed to withstand hurricane flooding through some smart engineering.
Yet this one town, Babcock Ranch, has been hit by four hurricanes and basically came out unscathed. There was no flooding at all. So we asked the engineer who helped build this town to break down its hidden designs.
Related: John Seabrook’s piece in this week’s New Yorker, In an Age of Climate Change, How Do We Cope with Floods? (archive).
Vermont feels like the frontier of climate change in the Northeast. Farmers in the bottomlands, who previously planted wheat and barley, are beginning to plant rice, which can be underwater for two days without damage to the crop. The old roads that early Vermont settlers hacked out on hilltops, which lasted for more than two hundred years, are melting back into the forest. Extreme-rain events scour the roads down to bedrock ledges, rendering them impassable, and, because no one then uses them, any blown-down trees don’t get cleared. The next storm brings more blowdowns. A road that I went mountain biking on ten years ago, when it was a distinct pathway with old-growth trees on each side, lined by aged stone walls, is now such a tangle of fallen trees, branches, and rocks that it’s hard to tell a road was ever there.
Vermont is the second least populated state, after Wyoming, with fewer than six hundred and fifty thousand residents; it is also the fourth highest in disaster-relief funding per capita, nearly all of it flood-related. Washington County ranked first nationally in disaster declarations between 2011 and 2024. Annual precipitation in the state has increased six inches since the nineteen-sixties, and heavier-than-normal rain events in the Northeast are expected to increase by as much as fifty-two per cent by 2100. Vermont is a laboratory for the study of intense rainfall in steep terrain, and a proving ground for scientists, policymakers, regulators, and land-use planners who are on the front lines of a recurring catastrophe that traditional methods of prevention — dredging a river’s bottom, armoring its sides, berming its banks — have only made worse.
I live in Washington County so how communities are attempting to mitigate flooding is of great interest to me.
This is a fun story about Sam Bartram, a goalkeeper who was accidentally left on the field when a 1937 game was called off during the second half due to heavy fog.
On Christmas Day 1937, Bartram was in the papers once more after a bizarre incident in a match against Chelsea at Stamford Bridge. With the score at 1-1, the game had to be called off on 61 minutes due to thick fog. Unfortunately for Bartram, he was the last to be made aware. “Soon after the kick-off, [fog] began to thicken rapidly at the far end, travelling past Vic Woodley in the Chelsea goal and rolling steadily towards me,” he wrote in his autobiography. “The referee stopped the game, and then, as visibility became clearer, restarted it. We were on top at this time, and I saw fewer and fewer figures as we attacked steadily.
“I paced up and down my goal-line, happy in the knowledge that Chelsea were being pinned in their own half. ‘The boys must be giving the Pensioners the hammer,’ I thought smugly, as I stamped my feet for warmth. Quite obviously, however, we were not getting the ball into the net. For no players were coming back to line up, as they would have done following a goal. Time passed, and I made several advances towards the edge of the penalty area, peering through the murk, which was getting thicker every minute. Still I could see nothing. The Chelsea defence was clearly being run off its feet.
“After a long time a figure loomed out of the curtain of fog in front of me. It was a policeman, and he gaped at me incredulously. ‘What on earth are you doing here?’ he gasped. ‘The game was stopped a quarter of an hour ago. The field’s completely empty’. And when I groped my way to the dressing-room, the rest of the Charlton team, already out of the bath and in their civvies, were convulsed with laughter.”
London fog is no joke.
P.S. BTW, the photo that frequently accompanies other online accounts of this story is not of Bartram. kottke.org: carefully fact-checking internet fun facts since 1998. 🤷♂️
Zoë Schlanger writes about the potentially dangerous and incredibly powerful hurricane now bearing down on Florida’s Gulf Coast and how it’s been supercharged in several ways by climate change.
As Hurricane Milton exploded from a Category 1 storm into a Category 5 storm over the course of 12 hours yesterday, climate scientists and meteorologists were stunned. NBC6’s John Morales, a veteran TV meteorologist in South Florida, choked up on air while describing how quickly and dramatically the storm had intensified. To most people, a drop in pressure of 50 millibars means nothing; a weatherman understands, as Morales said mid-broadcast, that “this is just horrific.” Florida is still cleaning up from Helene; this storm is spinning much faster, and it’s more compact and organized.
In a way, Milton is exactly the type of storm that scientists have been warning could happen; Michael Wehner, a climate scientist at Lawrence Berkeley National Laboratory, in California, called it shocking but not surprising. “One of the things we know is that, in a warmer world, the most intense storms are more intense,” he told me. Milton might have been a significant hurricane regardless, but every aspect of the storm that could have been dialed up has been.
My thoughts are with everyone in Milton’s path and also with those still recovering & cleaning up from Helene. Please stay safe, everyone.
You may not have noticed, but weather forecasts — temperature, precipitation, hurricane tracks — have improved greatly over the past few decades.
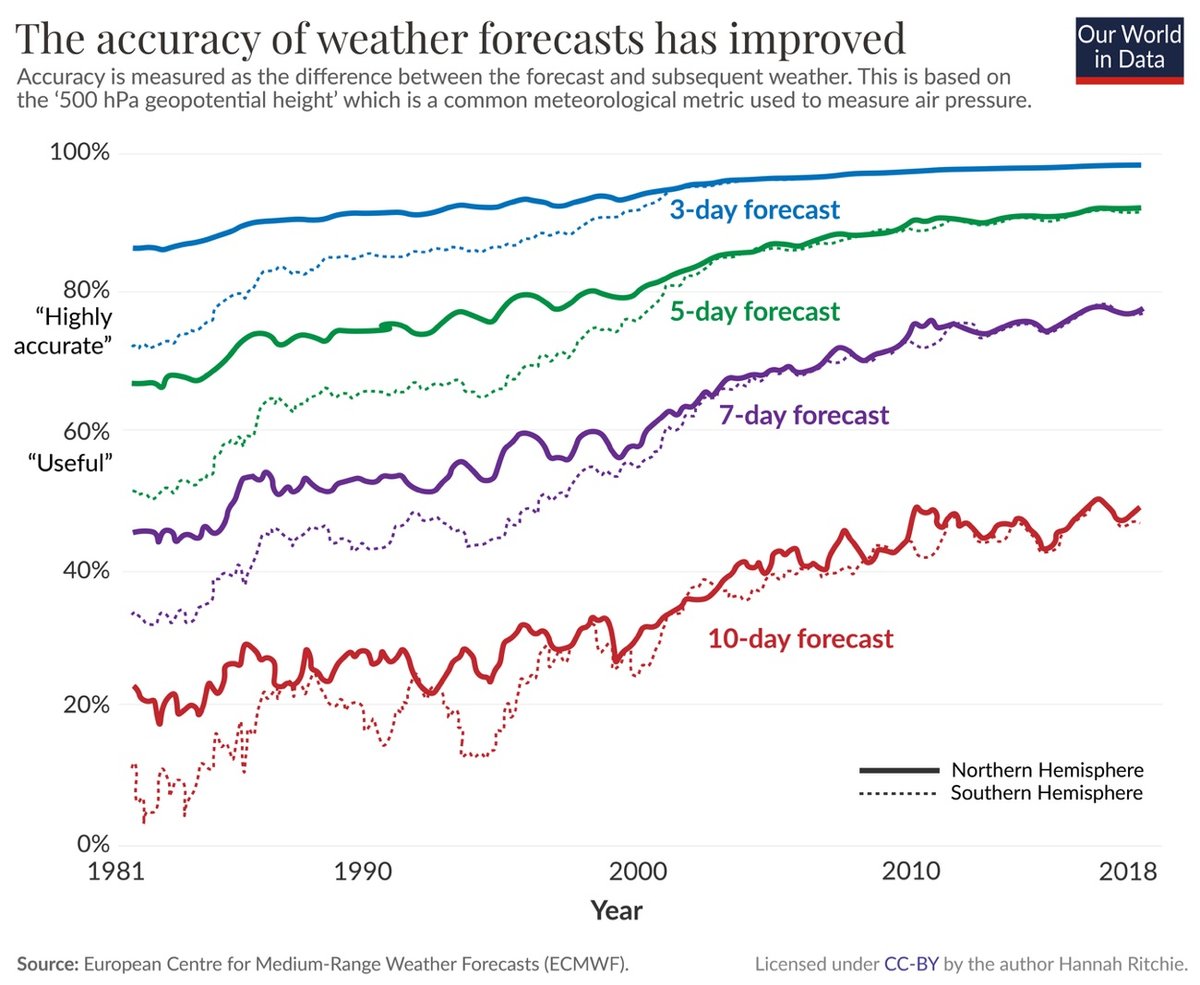
Dr. Hannah Ritchie of Our World in Data explains why.
The first big change is that the data has improved. More extensive and higher-resolution observations can be used as inputs into the weather models. This is because we have more and better satellite data, and because land-based stations are covering many more areas around the globe, and at a higher density. The precision of these instruments has improved, too.
These observations are then fed into numerical prediction models to forecast the weather. That brings us to the next two developments. The computers on which these models are run have gotten much faster. Faster speeds are crucial: the Met Office now chunks the world into grids of smaller and smaller squares. While they once modeled the world in 90-kilometer-wide squares, they are now down to a grid of 1.5-kilometer squares. That means many more calculations need to be run to get this high-resolution map. The methods to turn the observations into model outputs have also improved. We’ve gone from very simple visions of the world to methods that can capture the complexity of these systems in detail.
The final crucial factor is how these forecasts are communicated. Not long ago, you could only get daily updates in the daily newspaper. With the rise of radio and TV, you could get a few notices per day. Now, we can get minute-by-minute updates online or on our smartphones.
If you’re in the US, you can see how accurate the weather forecast is in your area by using ForecastAdvisor.
In the early days of the telegraph, station operators began sharing the local weather with each other. As the practice became more widespread, people started to realize that what happened in one location translated to later events in another location. Modern weather forecasting and the concept of weather systems were born.
The operators had discovered something both interesting and paradoxical, the writer Andrew Blum observes in his book The Weather Machine. The telegraph had collapsed time but, in doing so, it had somehow simultaneously created more of it. Now people could see what the future held before it happened; they could know that a storm was on its way hours before the rain started falling or the clouds appeared in the sky. This new, real-time information also did something else, Blum points out. It allowed weather to be visualized as a system, transforming static, localized pieces of data into one large and ever-shifting whole.
Almost 300 days out of every year, there are thunderstorms over Venezuela’s Lake Maracaibo. Called Catatumbo lightning — “Catatumbo means ‘House of Thunder’ in the language of the local Barí people” — the phenomenon is caused by the unique confluence of warm air and water from the Caribbean Sea with the cold air flowing down from the Andes, which nearly surround the lake. The result is near-nightly storms with the world’s highest density of lightning and up to 200 flashes in a minute. It sounds, literally, awe-some.
The short video above is a profile of photographer Jonas Piontek, who has captured some amazing photos and video of the Catatumbo lightning. The NY Times featured some of his photos in this piece about the lightning.
Less than half an hour after the first cloud forms, it starts to flash. It does this faster and faster - 200 flashes a minute is not uncommon. After that, the cloud becomes a giant bulb that lights up the night.
“You can read a newspaper in the middle of the night because it’s so bright,” said Jonas Pointek, a photographer who has documented the storms.
(via open culture)
If you live in any sort of winter climate, you have, at one time or another, wrestled with the two great mysteries of cold weather life:
1. Why does 50°F in the fall make you want to bundle up while 50°F in the spring makes you want to go for a walk in short sleeves?
2. Why the hell do kids wear shorts during the winter or go without coats when it’s literally freezing out? Like seriously, what the hell?
This short video answers both questions with one magical substance: brown fat.
55 degrees in the summer feels colder than 55 degrees in the winter. And 55 degrees as an adult likely feels colder than 55 degrees as a kid. But it’s not just a feeling. It all has to do with how our bodies use fat - specifically brown fat, a lesser-known type of fat that can produce roughly 300 times more heat than any other tissue in the body.
Brown fat isn’t the type of fat that adds to our weight (that’s white fat). Brown fat has the sole purpose of being burnt for heating the body, and it’s extremely effective at that. It only appears in specific parts of the body: around the neck, spine, heart, and kidneys. (It clumps around major blood vessels, in order to warm the blood as it passes through the body.)
In brief: 1. We have more brown fat in the spring, and 2. Kids have more brown fat in their bodies than adults. Cool! (har har)
I’ve featured storm chasing photographer Mike Olbinski’s work here on kottke.org pretty frequently. His latest video celebrates a decade of capturing haboobs (dust storms). Here’s a haboob primer:
Just how do haboobs form? When air is forced down and pushed forward by the front of a traveling thunderstorm cell, it drags with it dust and debris. Winds of speeds up to 60 mph can stir up dust and sand and create a blowing wall as high as 10,000 feet. Haboobs usually last only 10 to 30 minutes, but on rare occasions can last longer and create hazardous conditions for ground transportation systems, air traffic and motorists.
Sometimes the sky above powerful thunderstorms can light up in massive displays of color; they’re called transient luminous events. Whoa, I’ve never seen or heard of this phenomenon before!
On rare nights with clear visibility over powerful distant thunderstorms, you might be able to see and capture red sprites. Sprites are large scale electrical discharges occurring high above thunderstorms in the upper atmosphere. They are massive events, sometimes 50 kilometers tall by 50 kilometers wide. Sprites belong to a mysterious and colorful group of phenomenon called Transient Luminous Events, or TLEs. Other TLE’s include halos, Elves, trolls, secondary jets, Blue starters, Blue jets and the magnificent gigantic jets. But what exactly are these transient luminous Events, and how do they form?
This video is a great explainer about the phenomenon — how it arises, where the colors come from, etc. (via the kid should see this)
In major US metropolitan areas like Boston and Chicago that see significant winter snowfall, there’s a tradition of saving one’s shoveled-out street parking space with an object or objects that indicate to others that they should park elsewhere. After a big January storm, the Chicago Tribune posted a collection of photos of the best “parking dibs” in the city.
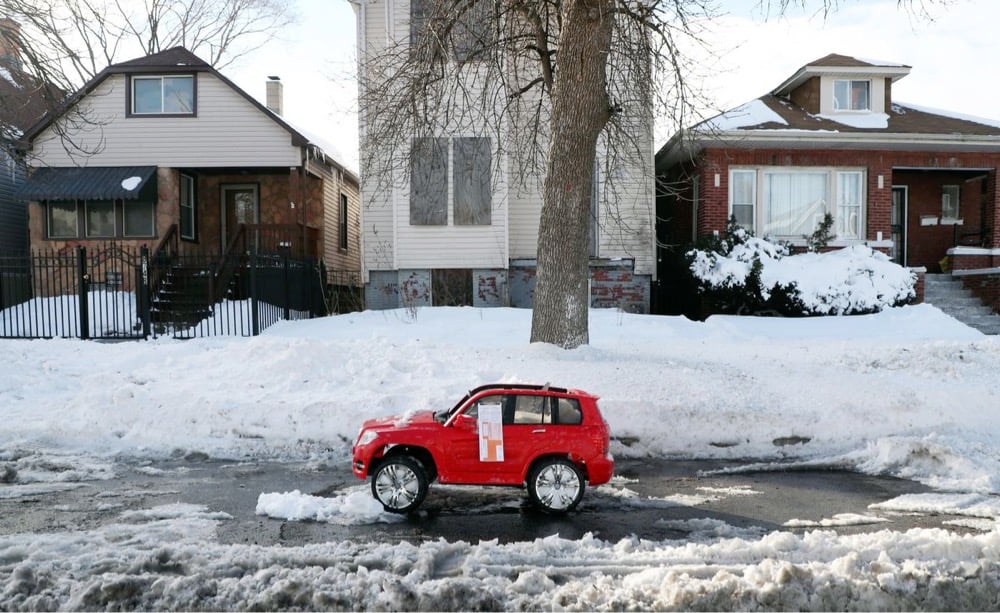
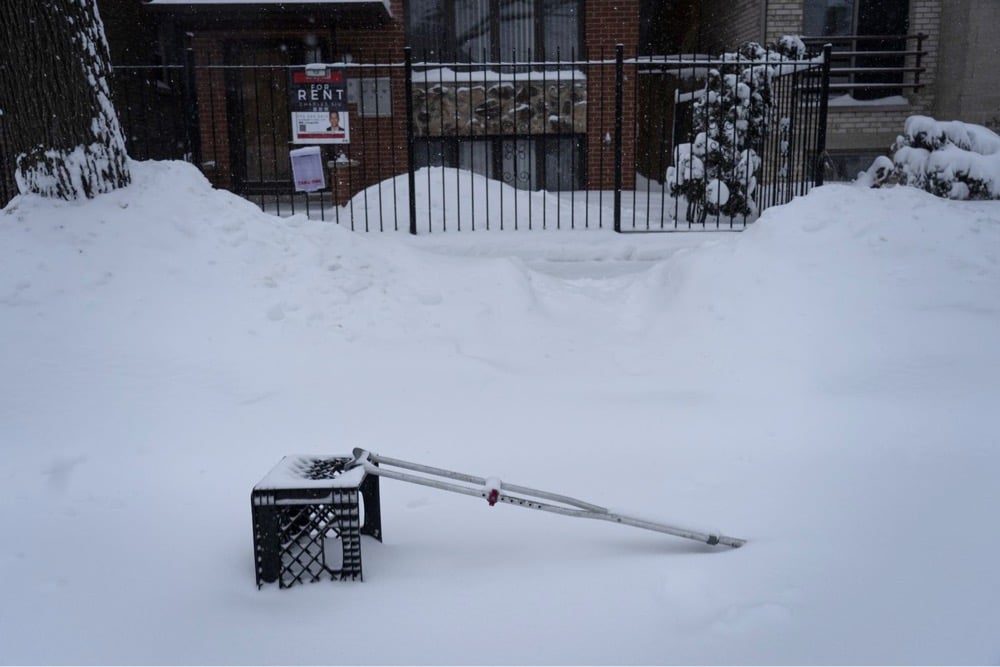
See also The Pittsburgh Parking Chair.
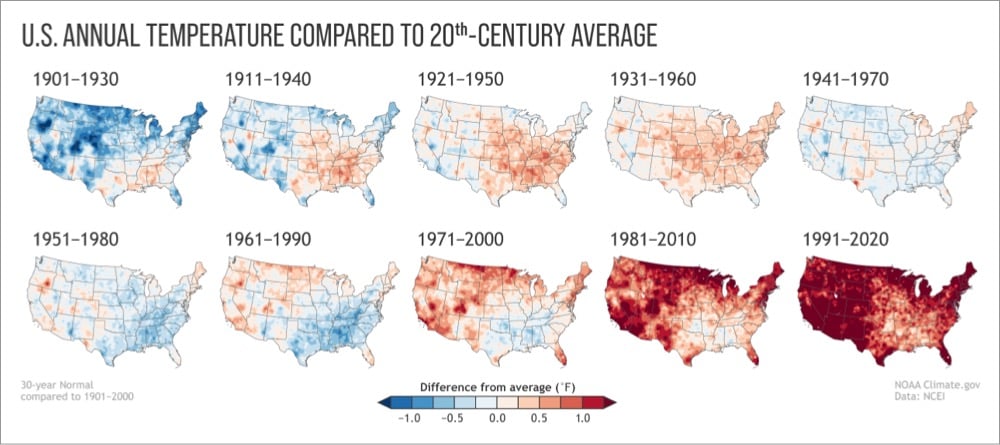
Every 10 years, the National Oceanic and Atmospheric Administration (NOAA) updates its definition of what it defines as “normal” weather.
As soon as the 2021 New Year’s celebrations were over, the calls and questions started coming in from weather watchers: When will NOAA release the new U.S. Climate Normals? The Normals are 30-year averages of key climate observations made at weather stations and corrected for bad or missing values and station changes over time. From the daily weather report to seasonal forecasts, the Normals are the basis for judging how temperature, rainfall, and other climate conditions compare to what’s normal for a given location in today’s climate.
They’re set to release the updated 1991-2020 Normals in early May and, crucially, these new normal climate conditions are not adjusted for climate change.
The last update of the Normals took place in 2011, when the baseline shifted from 1971-2000 to 1981-2010. Among the highlights of the rollout was the creation of a map showing how climate-related planting zones across the contiguous United States had shifted northward in latitude and upward in elevation. It was a clear signal that normal overnight low temperatures across the country were warmer than they used to be.
The planting zone maps emphasized a key point about the Normals and climate change: the once-per-decade update means these products gradually come to reflect the “new normal” of climate change caused by global warming. What’s normal today is often very different than what was normal 50 or 100 years ago. This gradual adjustment is the point: the purpose of the Normals is to provide context on what climate is like today, not how it’s changing over time.
This is literally shifting baselines in action.
So what are shifting baselines? Consider a species of fish that is fished to extinction in a region over, say, 100 years. A given generation of fishers becomes conscious of the fish at a particular level of abundance. When those fishers retire, the level is lower. To the generation that enters after them, that diminished level is the new normal, the new baseline. They rarely know the baseline used by the previous generation; it holds little emotional salience relative to their personal experience.
And so it goes, each new generation shifting the baseline downward. By the end, the fishers are operating in a radically degraded ecosystem, but it does not seem that way to them, because their baselines were set at an already low level.
Over time, the fish goes extinct — an enormous, tragic loss — but no fisher experiences the full transition from abundance to desolation. No generation experiences the totality of the loss. It is doled out in portions, over time, no portion quite large enough to spur preventative action. By the time the fish go extinct, the fishers barely notice, because they no longer valued the fish anyway.
I’ve been thinking a lot about shifting baselines recently — specifically in terms of how quickly people in the US got used to thousands of people dying from Covid every day and became unwilling to take precautions or change behaviors that were deemed essential just months earlier when many fewer people were dying. See also mass shootings.
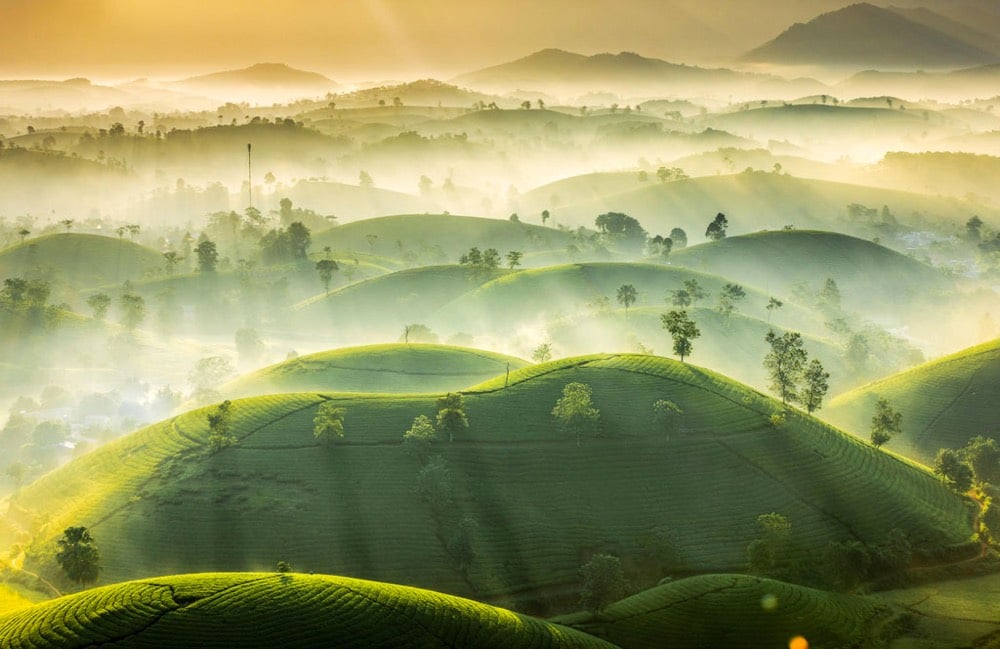
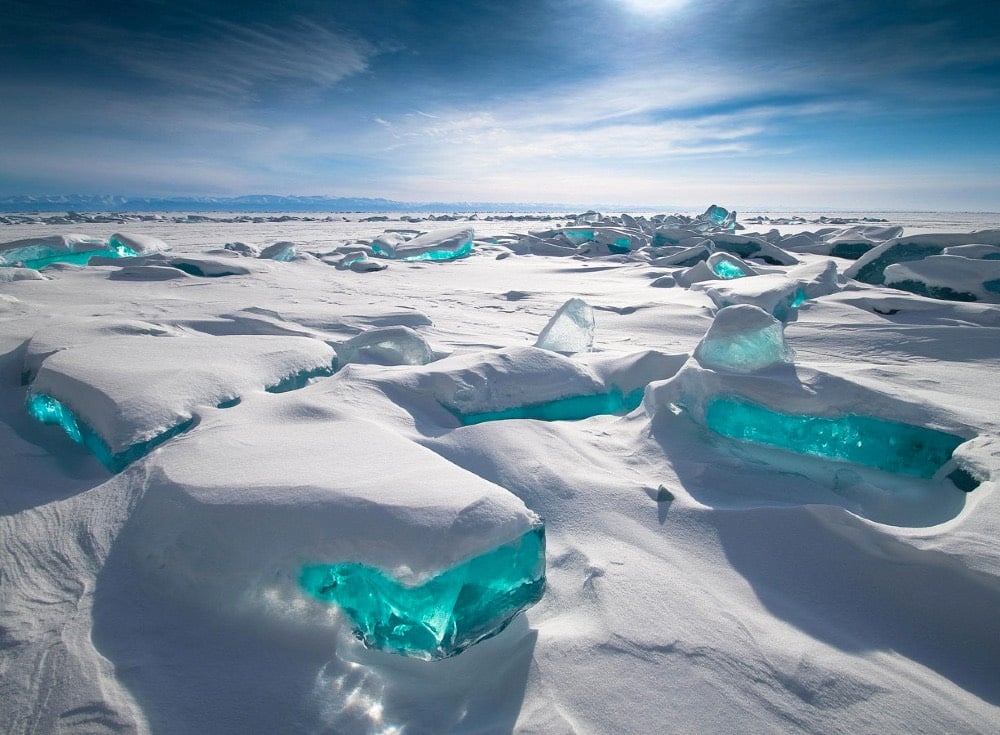
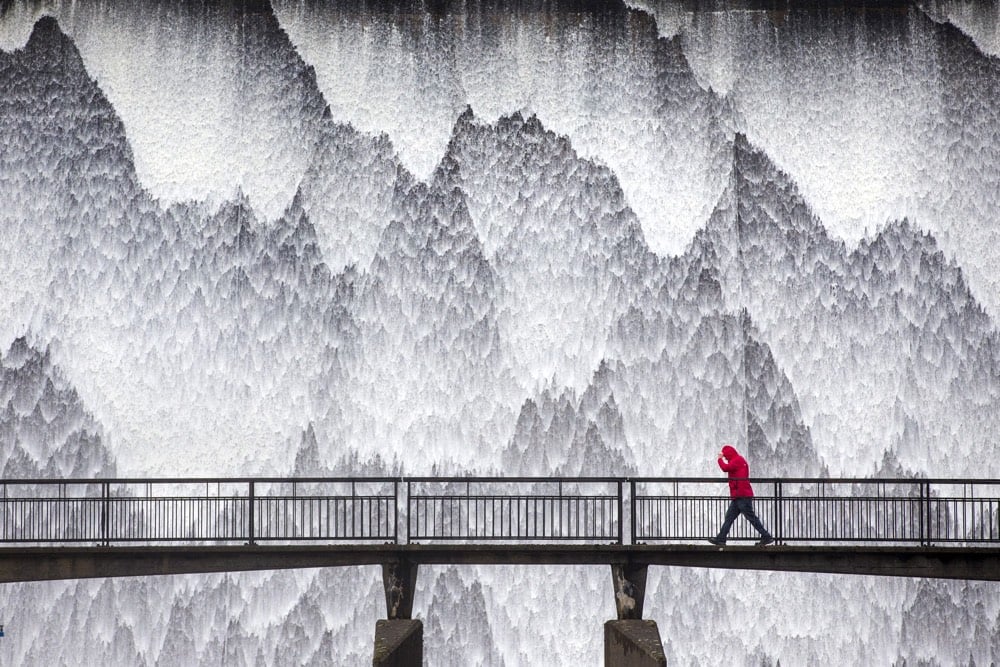
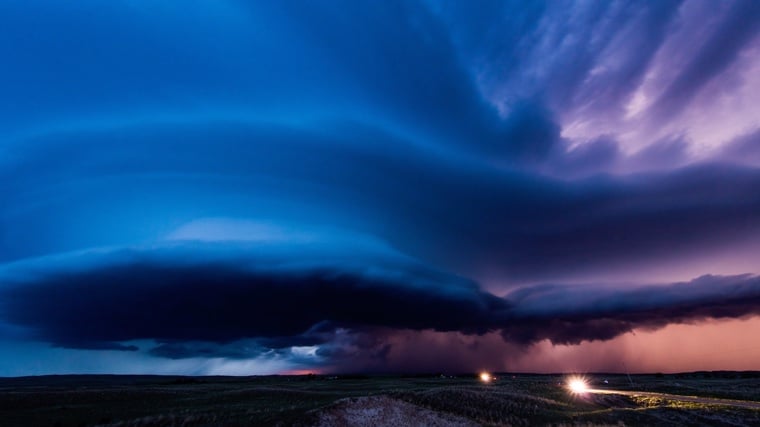
The Royal Meteorological Society has announced the winners and runners-up in the 2020 Weather Photographer of the Year competition. I shared some of my favorites above, but somehow none of the cloud pics made the cut? Am I feeling alright? *feels forehead* Ok, just one — I can’t resist cumulonimbus mammatus:
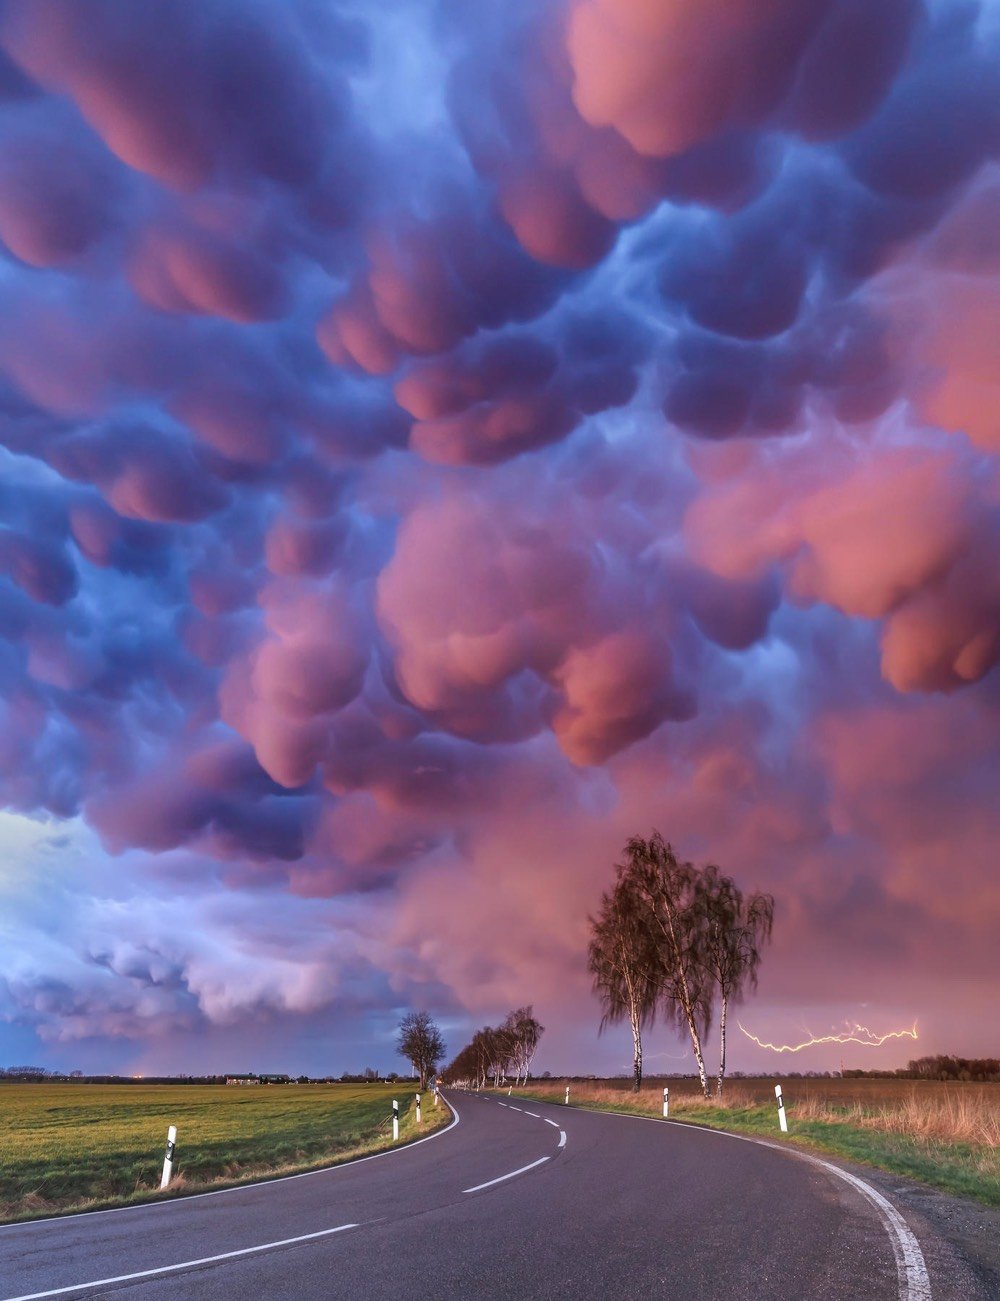
Photos by (top to bottom) Vu Trung Huan, Alexey Trofimov, Andrew McCaren, and Boris Jordan. (via moss & fog)
The first 30 seconds of this time lapse video provides a great look into how the 10 satellites that make up the Global Precipitation Measurement Constellation scan the surface of the Earth to provide daily global precipitation maps.
This visualization shows the constellation in action, taking precipitation measurements underneath the satellite orbits. As time progresses and the Earth’s surface is covered with measurements, the structure of the Earth’s precipitation becomes clearer, from the constant rainfall patterns along the Equator to the storm fronts in the mid-latitudes. The dynamic nature of the precipitation is revealed as time speeds up and the satellite data swaths merge into a continuous visualization of changing rain and snowfall.
Sometimes I load up the US map on Weather Underground just to watch storm systems tumbling and swirling across the country, so this 2-hour time lapse of the last 10 years of US weather radar is riiiiight up my alley. You don’t have to watch the whole thing — even dipping in here and there for a couple of minutes is really gratifying. Can you get ASMR from a weather map? (thx, benjamin)
We often talk about the damage we are doing to nature, and as often about the catastrophes this is bringing across the globe. And well we should. But we have to also remember that even when it looks enraged, nature is also worth our admiration. Mike Oblinsky gives us a good opportunity for this with his Vorticity 2 film.
For seven and a half minutes massive clouds tear through open skies across plains and mountain ranges, rainbows brighten the calm after the storms, and sheets of rain obliterate horizon lines.
The high temperature on Saturday in Guadalajara, Mexico was 86 °F. On Sunday morning, up to three feet of hail fell on the city and it looked like this:
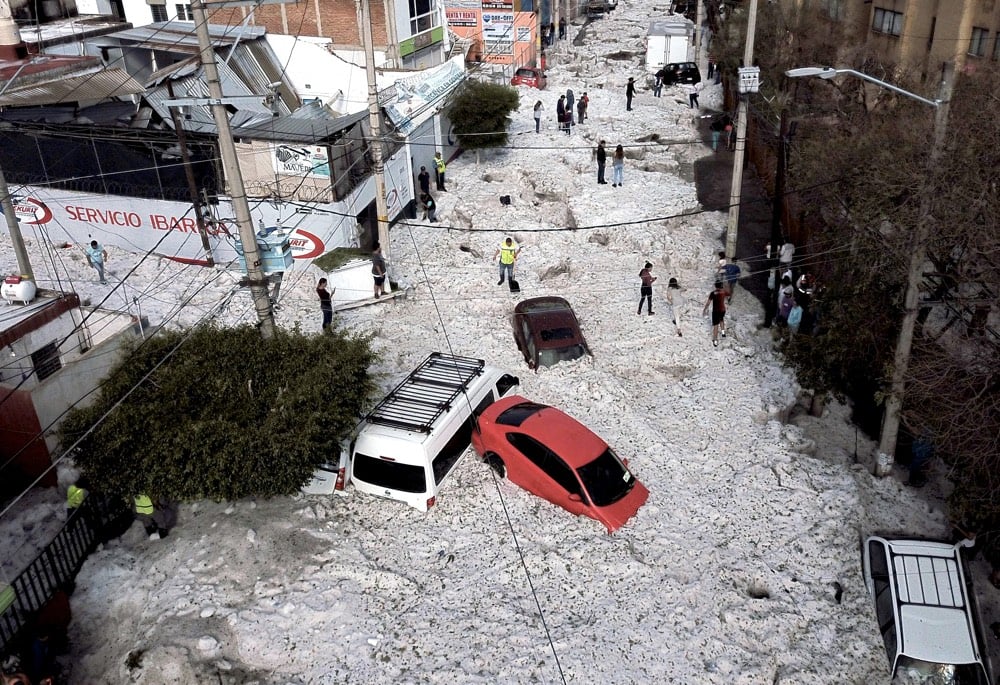
Enrique Alfaro, the governor of Jalisco, wrote on Twitter that he had never seen anything like it.
“I witnessed scenes that I had never seen before: hail more than a meter high,” he tweeted, “and then we ask ourselves if climate change exists.”
Weather is not climate, but our warmer atmosphere is going to make extreme weather events like this more likely and frequent. As the Times says with characteristic understatement:
Experts say it is not unusual to have a hailstorm at this time of year in western Mexico, but the amount of hail was extreme.
Now that the InSight lander is up and running on Mars, NASA is using the probe’s weather instrumentation to provide a daily weather report from the red planet.
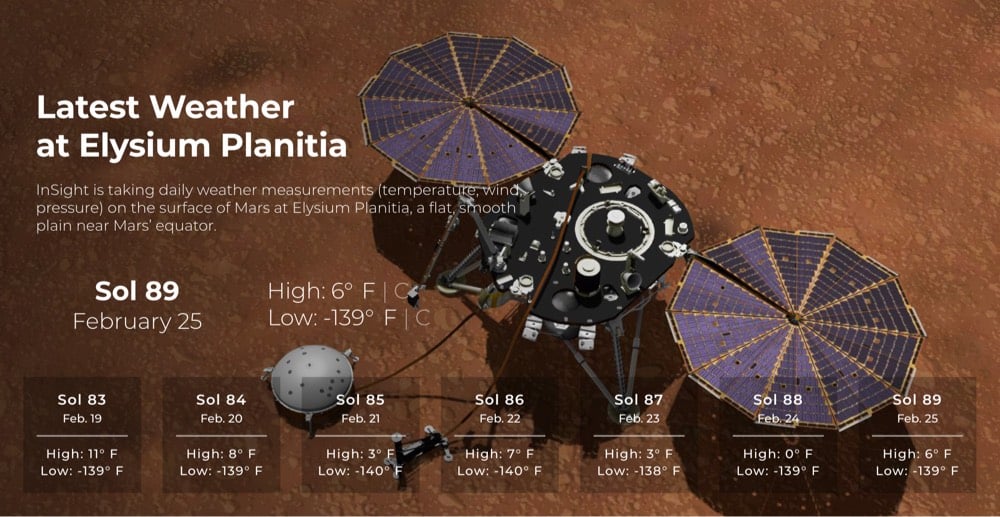
The report is delayed by a day or so (communications delay? non-essential data delay?), but it’s still really cool to see what the temperature, wind speed, and barometric pressure is at Elysium Planitia.
I’d just like to note for the record that at some point on Monday, it was actually warmer on Mars than it is right now in Vermont. ♫ Gotta get up, gotta get out, gotta get out into the Martian sun… ♫
As you can see on the US wind map, it’s been blustery in New England for the past couple of days. Yesterday the observatory atop Mount Washington in New Hampshire recorded a wind gust of 171 mph, the fastest gust ever recorded there in the month of February. This is what yesterday’s “Hays Chart” looked like:
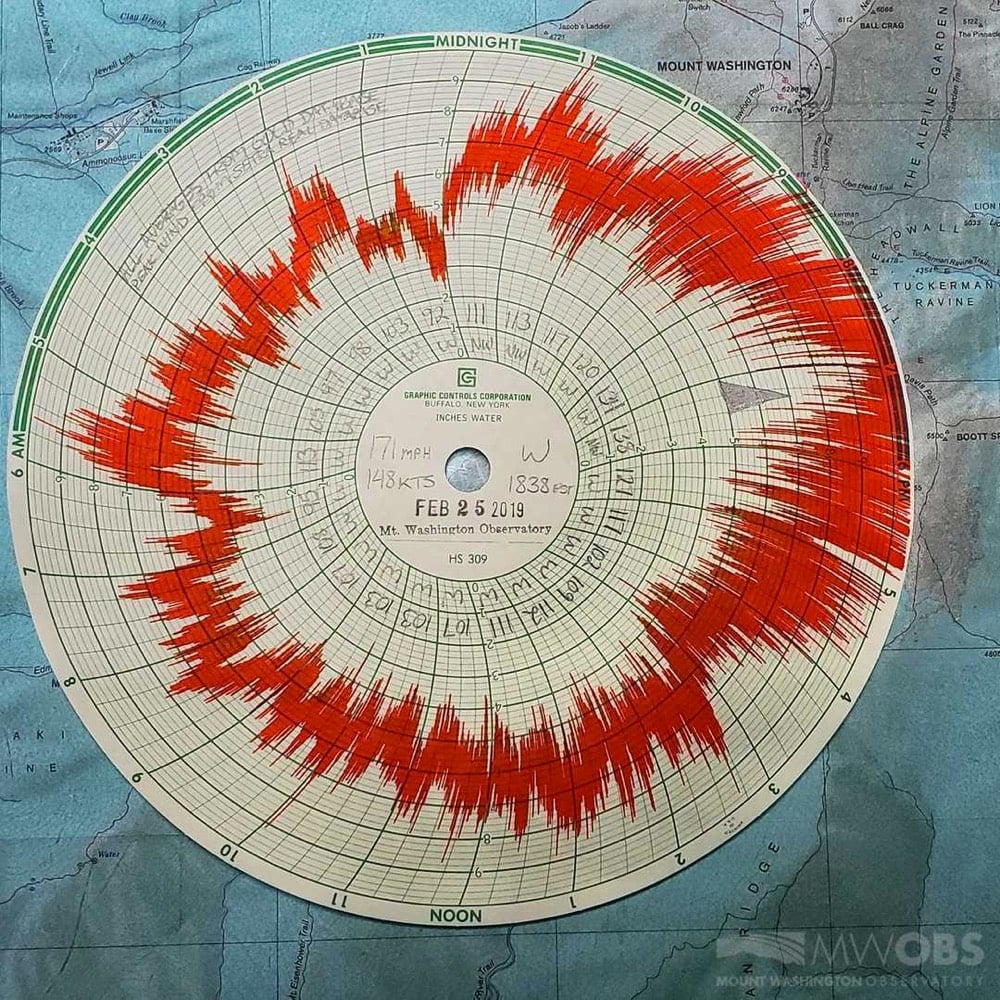
While it’s more that 50 mph slower than the 1934 record of 231 mph (!!), a look at the historical record shows that it’s one of the strongest winds ever recorded there and the strongest one since 1985.
While the observatory building itself is rated for winds up to 300 mph, humans venturing out at that speed might blow away. Here’s what a person battling 70-100 mph winds looks like:
On Instagram, someone at the observatory said of last night’s winds:
We could absolutely hear the winds yesterday! Sounded like a constant rumble similar to an earthquake. At the height of the storm our coffee mugs were shaking across the table and our bullet proof windows were constantly flexing back and forth.
(thx, meg)
In what is now an annual tradition, when the temperatures in some part of the US plunge below zero degrees on the Fahrenheit scale, some nitwit Republican climate change-denier live-tweets from the back pocket of industry something like “It’s so cold out where’s the global warming when we need it???? #OwnTheLibs”. This time around, it was our very own Shitwhistle-in-Chief who tweeted merrily about the current polar vortex bearing down on the Midwest:
In the beautiful Midwest, windchill temperatures are reaching minus 60 degrees, the coldest ever recorded. In coming days, expected to get even colder. People can’t last outside even for minutes. What the hell is going on with Global Waming? Please come back fast, we need you!
Some time ago, Randall Munroe addressed what severe cold in the US has to do with climate change on XKCD: it used to be colder a lot more often but we don’t really remember it.
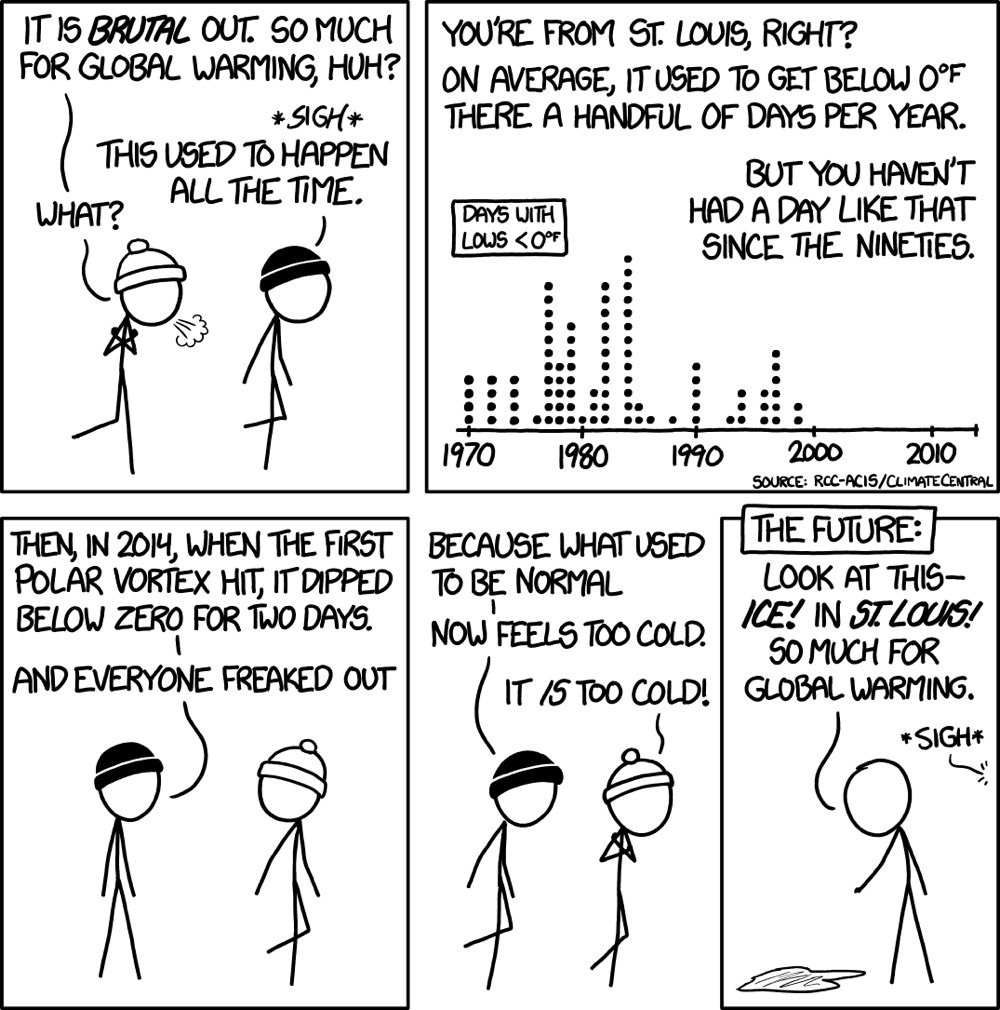
When I was a kid growing up in Wisconsin, I recall experiencing overnight low temperatures in the -30°F to -40°F range several times and vividly remember being stranded in my house for a week in 1996 when the all-time record low for the state (-55°F) was established in nearby Couderay.
Munroe’s observation isn’t even the whole story. Jennifer Francis, senior scientist at the Woods Hole Research Center, writes that the polar vortex bringing cold air into the Midwest is connected to the rapidly warming Arctic.
Because of rapid Arctic warming, the north/south temperature difference has diminished. This reduces pressure differences between the Arctic and mid-latitudes, weakening jet stream winds. And just as slow-moving rivers typically take a winding route, a slower-flowing jet stream tends to meander.
Large north/south undulations in the jet stream generate wave energy in the atmosphere. If they are wavy and persistent enough, the energy can travel upward and disrupt the stratospheric polar vortex. Sometimes this upper vortex becomes so distorted that it splits into two or more swirling eddies.
These “daughter” vortices tend to wander southward, bringing their very cold air with them and leaving behind a warmer-than-normal Arctic.
(via @mkonnikova)
This is mesmerizing to watch for a few minutes: a time lapse map of weather activity across the entire US in 2018. I was thinking it would be instructive to see this sped up a bit more, that perhaps different patterns might reveal themselves, and then I remembered that you can control the playback speed on YouTube videos…just click the gear icon. I think I like the 2X version better. (via @DesignObserver)
Using a combination of satellite data and mathematical weather models, scientists at NASA’s Goddard Space Flight Center made this simulation that shows how aerosols like dust, smoke, and salt were circulated in the atmosphere during the 2017 hurricane season. It’s amazing to see how far some of these things spread.
During the 2017 hurricane season, the storms are visible because of the sea salt that is captured by the storms. Strong winds at the surface lift the sea salt into the atmosphere and the particles are incorporated into the storm. Hurricane Irma is the first big storm that spawns off the coast of Africa. As the storm spins up, the Saharan dust is absorbed in cloud droplets and washed out of the storm as rain. This process happens with most of the storms, except for Hurricane Ophelia. Forming more northward than most storms, Ophelia traveled to the east picking up dust from the Sahara and smoke from large fires in Portugal. Retaining its tropical storm state farther northward than any system in the Atlantic, Ophelia carried the smoke and dust into Ireland and the UK.
I watched this several times to pick up on different things…the hurricanes of course, but also how smoke from the forest fires in the Pacific Northwest makes it all the way to Scotland (!!!) and dust from the Sahara desert makes it to the Caribbean (also !!!). (via phil plait)
Update: All that dust from the Sahara blowing across the ocean? Some of the dust, 27 million tons per year on average, is deposited in the Amazon basin in South America, providing the ecosystem there vital phosphorus:
This trans-continental journey of dust is important because of what is in the dust, Yu said. Specifically the dust picked up from the Bodélé Depression in Chad, an ancient lake bed where rock minerals composed of dead microorganisms are loaded with phosphorus. Phosphorus is an essential nutrient for plant proteins and growth, which the Amazon rain forest depends on in order to flourish.
(via tom whitwell)
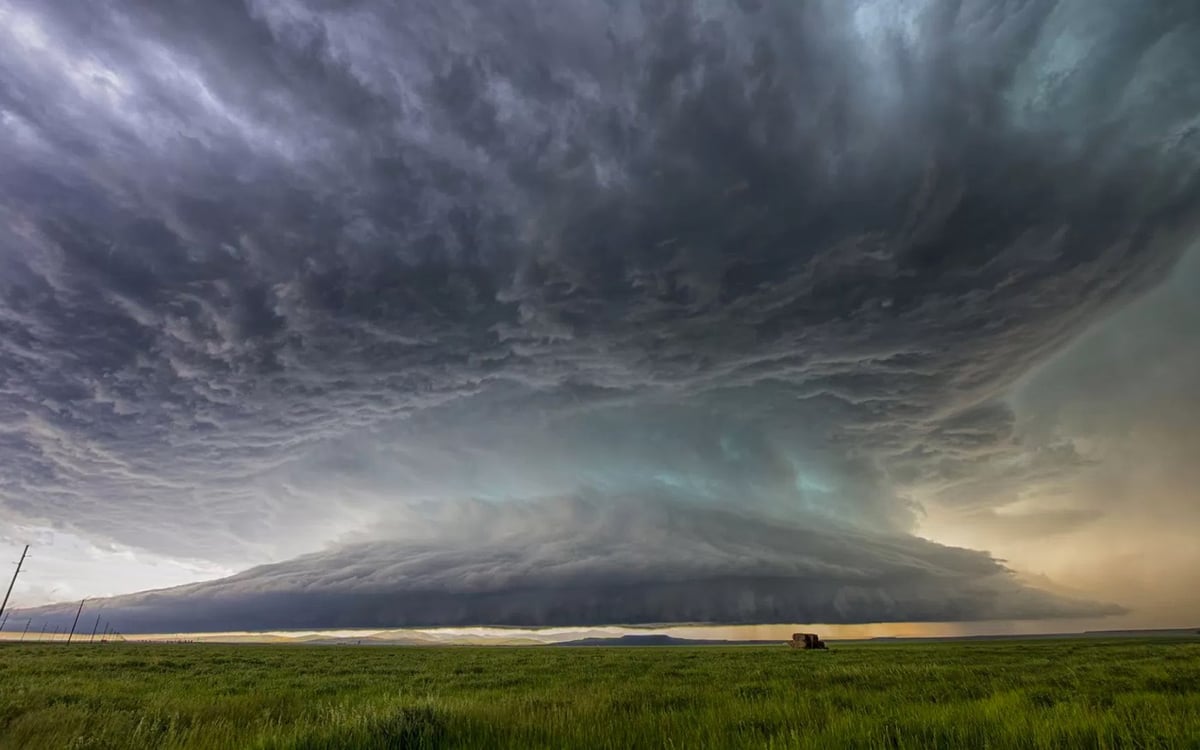
This photo of a storm supercell in Montana taken by Ryan Wunsch? Wowza. I can see why people get hooked on chasing these storms about western North America…I’d love to see something like that in person. (via @meredithfrost)
Usually, the air nearest the Earth is the warmest and it gets cooler as the altitude increases. But sometimes, there’s a meteorological inversion and colder air gets trapped near the ground with a layer of warmer air on top. While working on a dark sky project, Harun Mehmedinovic shot a time lapse movie of a rare cloud inversion in the Grand Canyon, in which the entire canyon is filled nearly to the brim with fluffy clouds. (via colossal)
Photographer and filmmaker Mike Olbinski shot 85,000 frames at 8K resolution to make this 7-minute time-lapse film of storms of all shapes and sizes doing their thing. Just slip on the headphones, put the video on fullscreen, and then sit back & watch. A tonic for these troubled times. (via slate)
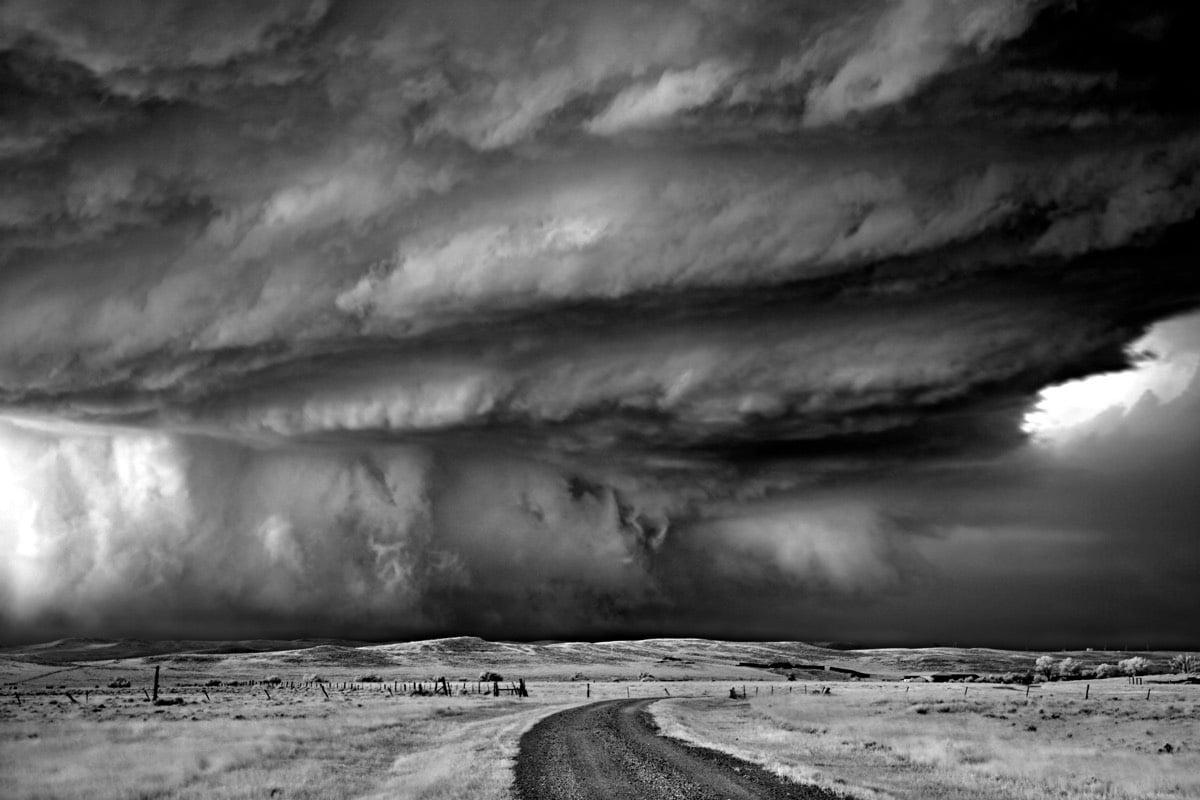
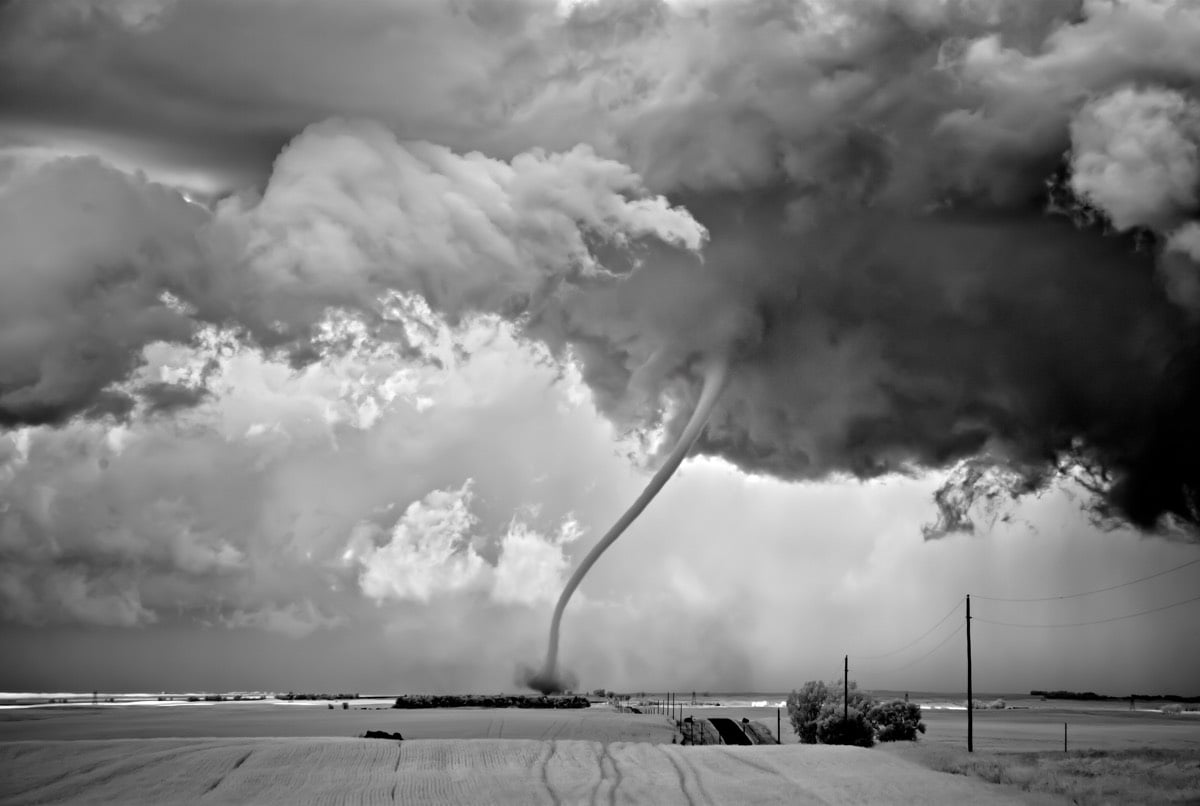
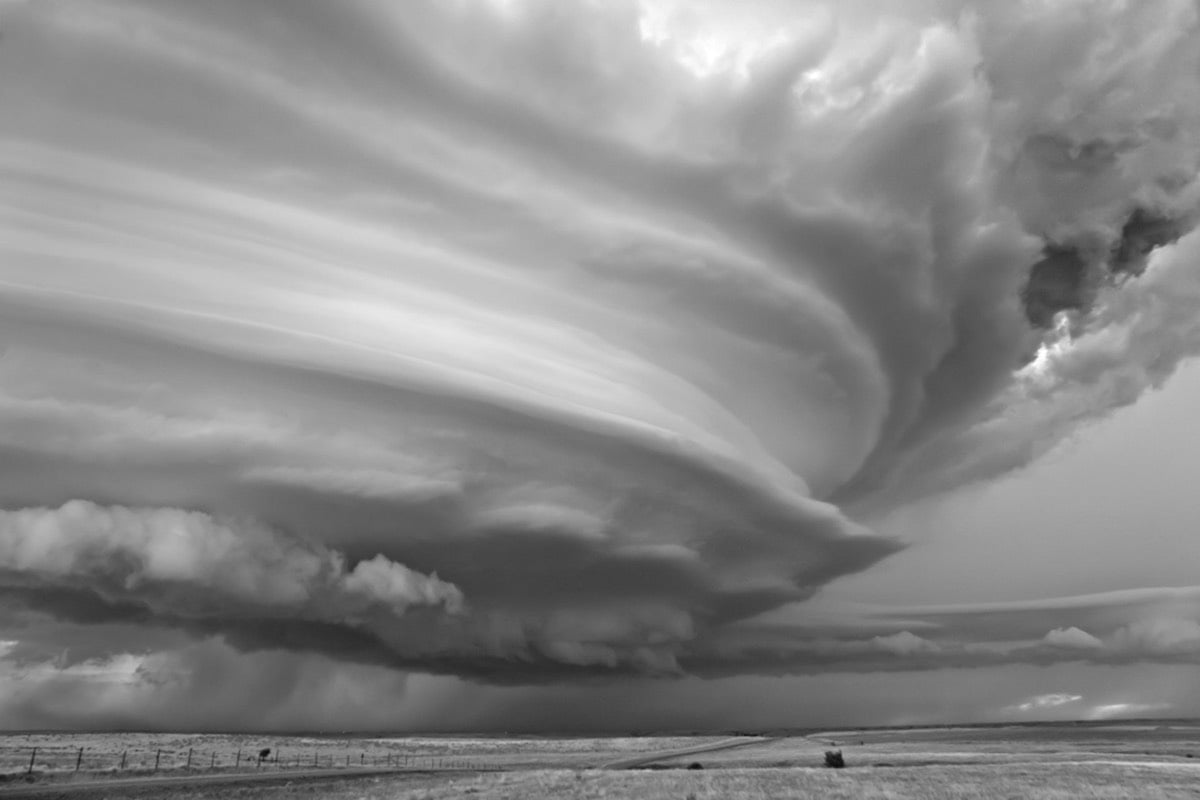
Mitch Dobrowner takes wonderfully dramatic black & white photos of clouds and storms from across the plains of the central United States. Dobrowner, who lives in California, became “addicted” to photography as a teen after discovering Ansel Adams and Minor White but then gave it up to spend energy on his career and family. A few years ago, he picked his old obsession back up and these storm photos are the result. (via colossal)
Older posts
Socials & More