kottke.org posts about cities
At Streetsblog, Angie Schmitt has compiled a handy list of all the ways in which ride sharing services like Uber and Lyft are having significant negative effects on our cities, the environment, and our health.
Uber and Lyft are just crushing transit service in the U.S. A recent study estimated, for example, they had reduced bus ridership in San Francisco, for example, 12 percent since 2010 — or about 1.7 percent annually. And each year the services are offered, the effect grows, researcher Gregory Erhardt found.
Every person lured from a bus or a train into a Lyft or Uber adds congestion to the streets and emissions to the air. Even in cities that have made tremendous investments in transit — like Seattle which is investing another $50 billion in light rail — Uber and Lyft ridership recently surpassed light rail ridership.
Transit agencies simply cannot complete with private chauffeur service which is subsidized at below real costs by venture capitalists.
Uber and Lyft (and their investors) clearly aren’t going to stop…it’s up to cities and communities to take action. They can’t just let these companies ruin their transit until ride sharing is the only thing left.
In 1981, a Berkeley urban design professor named Donald Appleyard published a book called Livable Streets (now out of print). In it, he described the results of research he’d done in the late 1960s about the effects of car traffic on the people who live in cities. For the study, he selected three similar residential streets in San Francisco that only differed in the amount of street traffic and then measured how the residents used their streets.
To illustrate his findings, Appleyard used these simple and revealing maps of the data he collected. The first map shows gathering spots on the streets and the friendships made amongst neighbors:
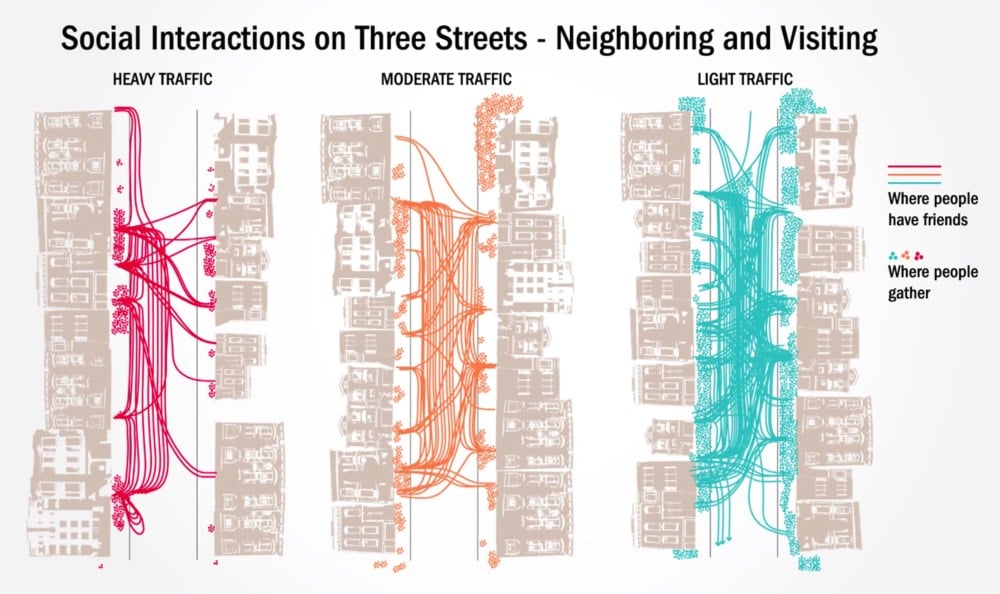
The second map shows what residents considered their “home territory” on their street:
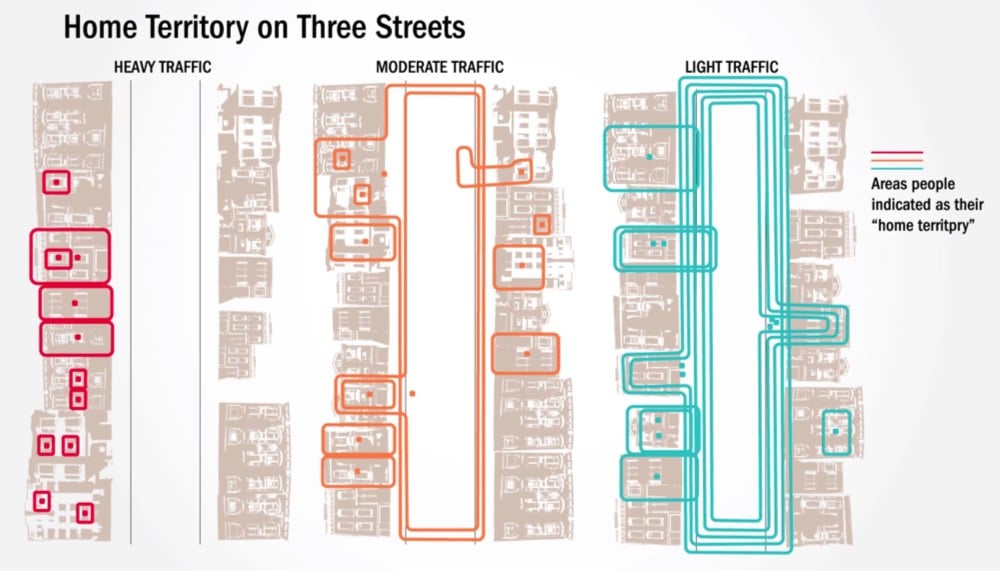
What Appleyard found was that the amount of car traffic on the street dictated how friendly neighbors were with each other, how “at home” people felt in their neighborhood, and how familiar they were with their surroundings.
In the late 1960s Appleyard conducted a renowned study on livable streets, comparing three residential streets in San Francisco which on the surface did not differ on much else but their levels of traffic. The 2,000 vehicles per day street was considered Light Street, 8,000 traveled on Medium Street and 16,000 vehicles passing down Heavy Street. His research showed that residents of Light Street had three more friends and twice as many acquaintances as the people on Heavy Street.
Further, as traffic volume increases, the space people considered to be their territory shrank. Appleyard suggested that these results were related, indicating that residents on Heavy Street had less friends and acquaintances precisely because there was less home territory (exchange space) in which to interact socially.
Light Street was a closely knit community. Front steps were used for sitting and chatting, sidewalks for children to play and for adults to stand and pass the time of day, especially around the corner store, and the roadway for children and teenagers to play more active games like football. Moreover, the street was seen as a whole and no part was out of bounds.
Heavy Street, on the other hand, had little or no sidewalk activity and was used solely as a corridor between the sanctuary of individual homes and the outside world. Residents kept very much to themselves, and there was virtually no feeling of community. The difference in the perceptions and experience of children and the elderly across the two streets was especially striking.
Cars separate people from each other and so does traffic. As @wrathofgnon put it:
This was in 1969, and here we are today in 2018 still building these terrible anti-human suburbs and cities. There is no progress, and there certainly is no science, when we ignore basic common sense and even the studies that prove it.
In 1973, just a few years after Appleyard conducted his research, George Lucas’s ode to American car culture, American Graffiti, came out. Even with the gas and oil shortages in the 1970s, the sense of freedom, rebellion, and individualism depicted in American Graffiti and similar films like The French Connection, Bullitt, Smokey and the Bandit, and Cannonball Run won out over Appleyard’s attempts to show how cars wrecked the social fabric of cities. It was no contest…Americans love cars.
In a sad twist of fate, Appleyard died relatively young at 54 — he was struck and killed by a speeding car in Athens, Greece in 1982.
At the end of October, I spent barely 48 hours in Istanbul — too quick, but I saw a lot of stuff in a short time. When planning this trip, I had a lot of different thoughts about places I could go — the American Southwest, Barcelona, London, Edinburgh, Seattle/Portland, Miami — but the thing that really sold me was a relatively cheap plane ticket that would take me to both Berlin and Istanbul. A two-fer? Sign me up. I’d been to Berlin before, but I was a bit nervous about Istanbul because it seemed so culturally different than other places I’d been. I needn’t have worried.
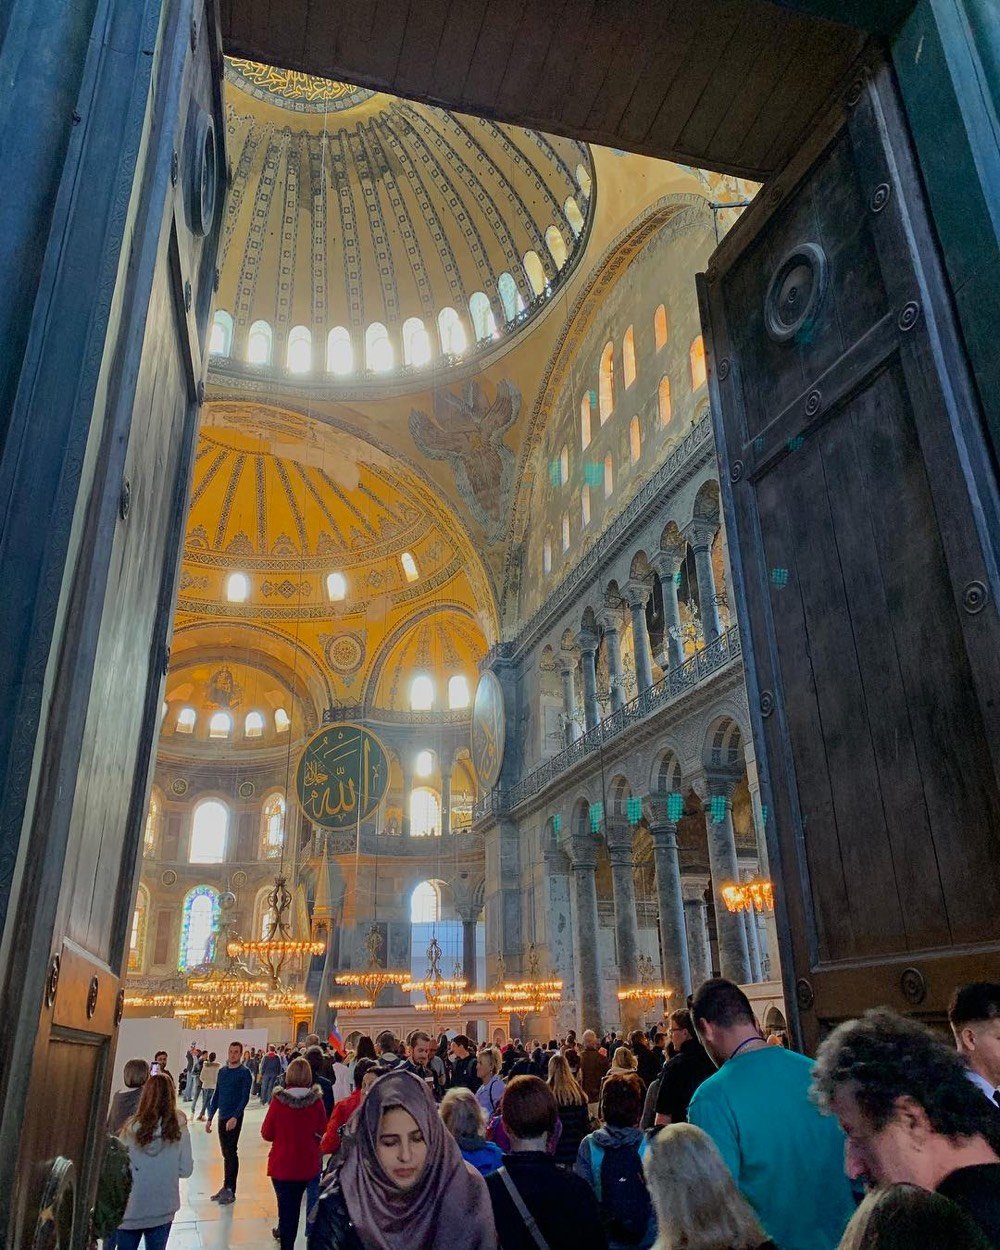
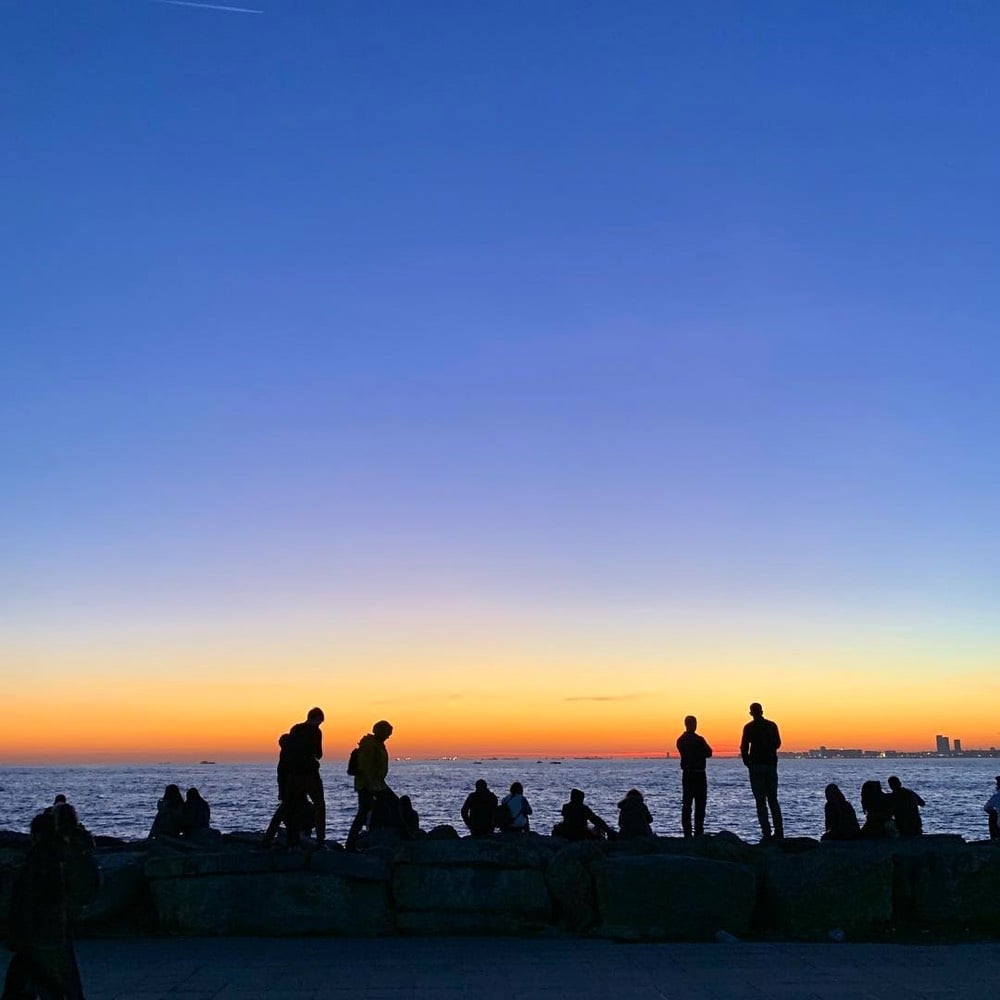
Just after I had checked into my hotel room, I heard a chanting voice over a loudspeaker coming from outside. I opened my window for a better listen — it was the adhan (the Muslim call to prayer) for the sunset prayer (probably from the Hagia Sophia, which was quite close). As I walked around the city for the next day and a half, I heard the adhan several more times. Watching the sunset in Kadikoy, you could hear the call ringing out from several mosques across the city, nearly in unison. I’m not Muslim or even remotely religious, so I was surprised at how much I liked hearing it. As with tolling European church bells, the calls to prayer knits cities together in an auditory way that secularism has yet to manage.
The nightstand in my hotel room had a sticker on it pointing the direction to Mecca. (There are apps to help with this as well.)
There are cats all over the place in Istanbul — I must have seen a dozen inside Hagia Sophia alone. My friend Jodi investigated why there are so many cats in the city.
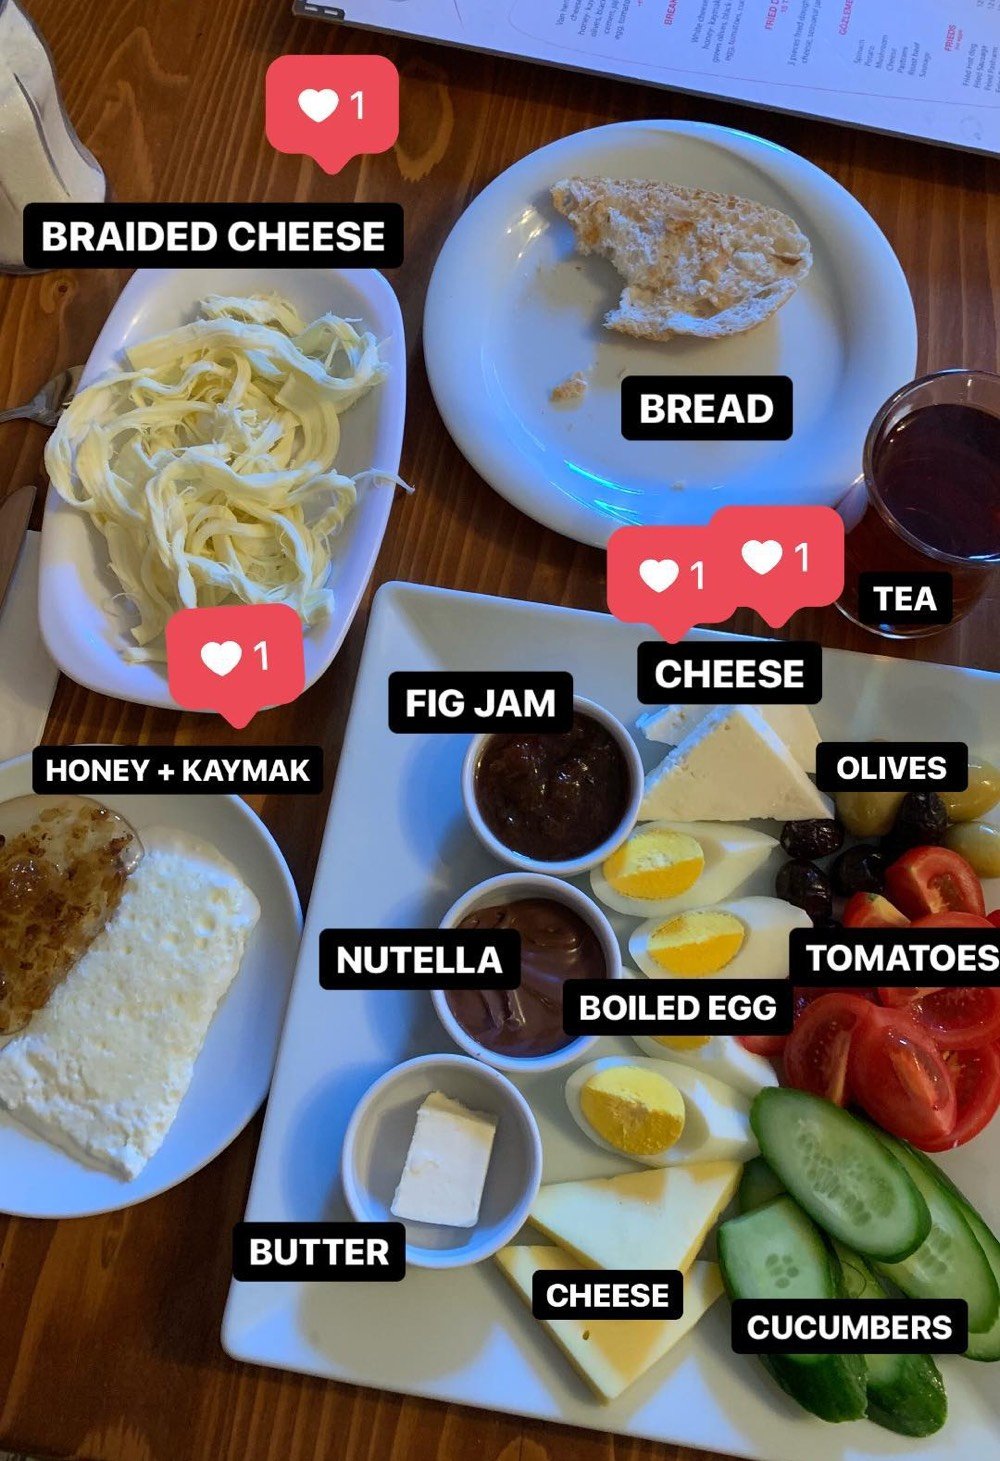
My first morning in Istanbul, I headed to Van Kahvalti Evi for breakfast on the strong recommendation of a reader. What greeted me was an amazing breakfast, the best I have had in quite some time (annotated above). As I was dining solo, I wasn’t able to get full breakfast (it was for 2+ people only), but I did pretty well. My favorites were the braided cheese, kaymak & honey, and the saltiest fresh cheese. The couple sitting next to me ordered the full breakfast and the waiter’s tray was like a magical clown car…he just kept putting little plates of delicious cheeses and pastes and fruits onto the table until it was completely covered. The freshness of everything was underscored by that morning’s food delivery coming in through the front door and streaming past me, a seemingly endless procession of fresh fruit, vegetables, and such. Highly recommended.
Everything I read about Istanbul taxis basically said to avoid them at all costs because they try to rip you off (and I’m not a huge fan of taxis on a good day), so that’s what I did. Upon landing, I bought an Istanbulkart to use the metro & ferries the whole time I was there. Getting from the airport to my hotel was pretty easy on the metro (thanks Citymapper), didn’t take too much longer than a taxi would have, and cost a lot less. Tip: machines are cash only, so you’d better have some Turkish lira on hand before exiting the airport.
Istanbul is not a bicycle city, at least not in the areas I visited. I saw maybe three people on bikes the entire time I was there? For starters, the city streets in the oldest parts of town are so small there’s nowhere to even put bike lanes. And then there are the hills, which made walking challenging at times, never mind biking. Even where there are dedicated lanes, they can be overwhelmed by pedestrians. In a park in Kadikoy, the balık ekmek (fish sandwich) vendors set up their carts right in the bike lane.
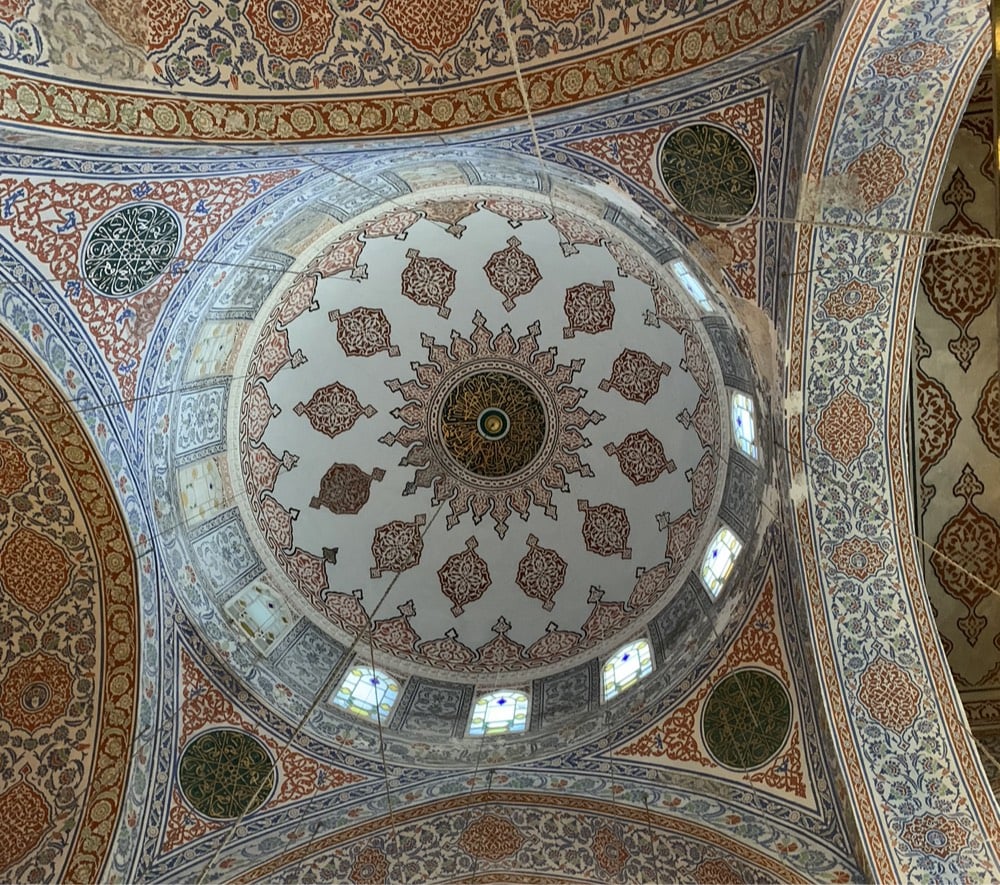
Although the interior was being renovated when I visited, Hagia Sophia was staggeringly impressive. Originally built in just under six years by Emperor Justinian, ruler of the Byzantine Empire (aka what was left of the Holy Roman Empire after the fall of Rome in the 5th century), it was completed in 537 as the world’s largest building and largest cathedral, retaining the latter title for almost 1000 years. Justinian wanted Hagia Sophia to be the biggest church in the world, partially for the glory of God and partially to best his peers. At the building’s dedication, he was recorded as saying, “My Lord, thank you for giving me chance to create such a worshipping place” followed by “Solomon, I have outdone you.” in reference to Solomon’s temple in Jerusalem. IN YOUR FACE SOLOMON!
Hagia Sophia was Byzantine until 1204, Roman Catholic for more than 50 years, and Greek Orthodox for about 200 years after that. In 1453, Mehmed the Conqueror of the Ottoman Empire — wait for it… — conquered Constantinople and turned Hagia Sophia into a mosque. It became a museum in 1935. Walking around inside it, you can see and feel all of this history, layered all around you. The marble floors are worn down from centuries of devoted foot traffic. The wear pattern is uneven due to differing hardnesses of the rocks in the marble, giving the floor a marvelous wavy quality. The Christian aspects of the church were covered or destroyed when the church was converted to a mosque, but now they peek through here and there again. A remarkable experience of time travel through cultures, mirroring Istanbul’s own long and varied history as a crossroads between East and West.
I pretty much had the They Might Be Giants cover of Istanbul (Not Constantinople) on repeat in my head the entire time I was in town.
Along with many of its tourists, the overwhelming majority of Turkey’s population is Muslim, so it wasn’t surprising to see women with headwear like hijabs and niqabs all over in Istanbul. I have lots of thoughts about this religious and cultural practice, but mostly it made me think about how the dress of women in the US and other western countries is also restricted by our culture in many ways.
As I had less than 48 hours to spend in Istanbul, I mainly stayed in the central part of the city where most of the tourists were. Walking around was unpleasant at times because it seems like almost everyone is trying to sell you something. In the busiest areas near the top attractions and restaurants, someone tried to sell me a tour, a rug, a meal, or some sweets about every 30 seconds. It was oppressive. I mentioned this to a friend of mine and she said, “Now you know how women feel all the time walking around pretty much everywhere.”
The constant selling also put my guard up far more than it normally is (which is admittedly pretty high). In Taksim Square, a guy asked me for a light and we struck up a conversation. Super friendly guy, said his name was Ahmed, hailed from Qatar, in town for the day on his way to London, was a computer programmer, wasn’t particularly religious, liked travlling alone because his girlfriend (a lawyer) worked and talked too much. He was pleased to find me because this meant us two solo travellers could hang out for the evening. He’d asked at his hotel where to go and was heading towards this place with whiskey and belly dancing. Now, this is the point in the story where I’m supposed to head off into the evening with Ahmed and have an adventure. But because of the constant barrage of selling (plus I was sick and tired and wasn’t drinking), I mostly felt like I was being scammed and that “Ahmed” was actually pals with the guy who owned this belly dancing establishment and was tasked with suckering tourists like me into the place to spend money. Was he just a friendly guy or just another salesman? I still don’t really know, but I bid Ahmed a firm goodbye and still have not crossed “see belly dancing in Istanbul with a stranger” off of my bucket list.
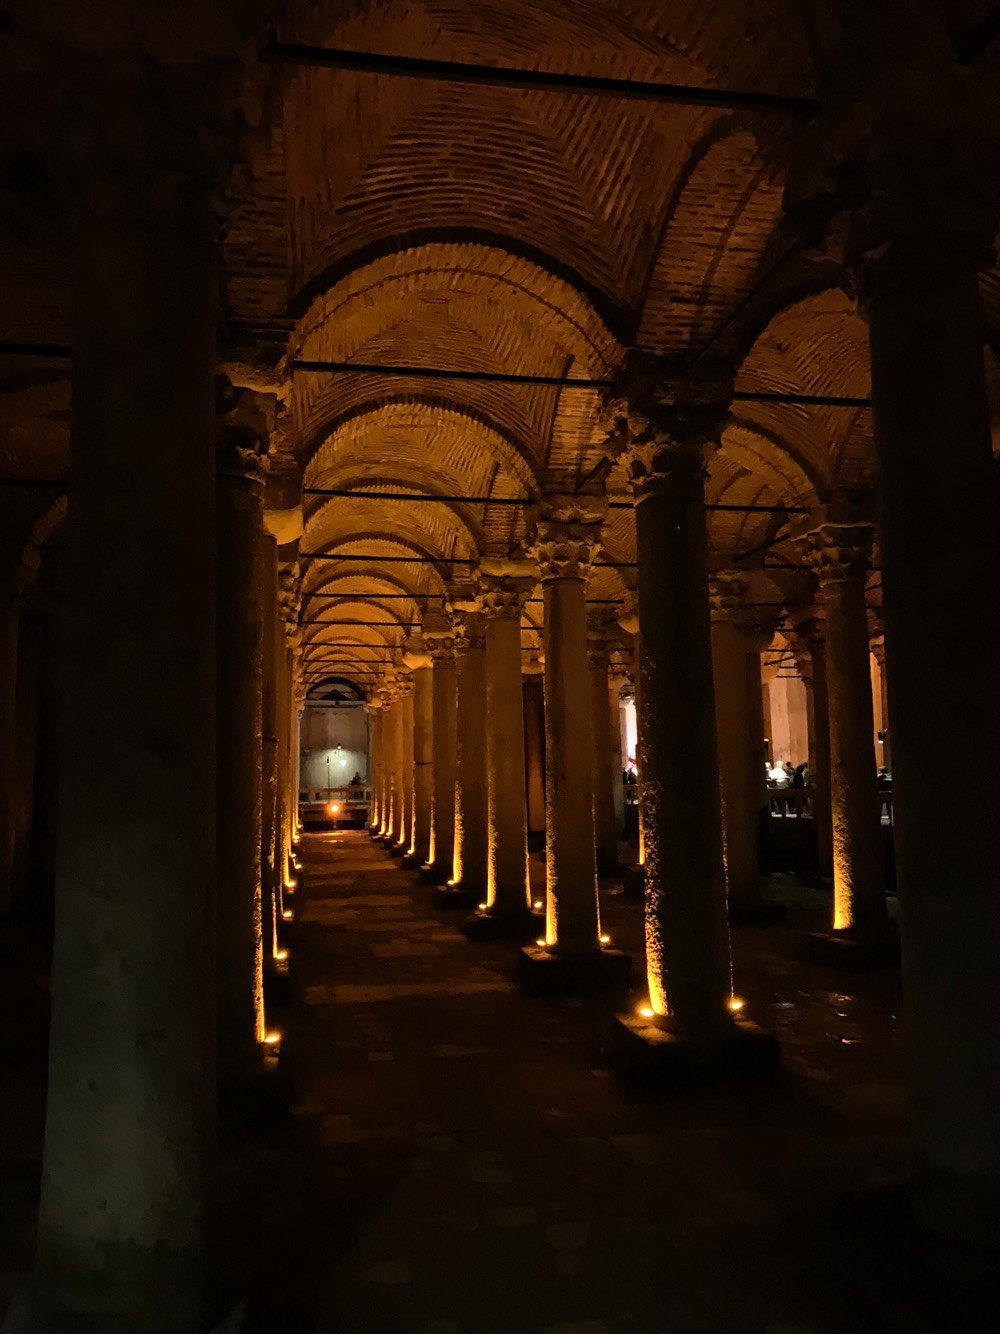
But the next day, I finally succumbed to the relentless pressure. As I was contemplating joining the longish line at the Basilica Cistern, I made the mistake of looking contemplative, as if I were perhaps confused. A man came up to me, asked me if I spoke English, and then said I should come back later when the line is shorter. “Don’t worry,” he said, “I’m not trying to sell you a tour. I’m just on my way back to work from lunch.” Thus disarmed, we started chatting. His name was Musa and he had a business just up the street…perhaps he could give me his card and I could come for a visit tomorrow? Maybe, I said, wanting to be polite. We chatted some more, about other things. I agreed to go with him to get his business card; he still had not mentioned what business he was in…something to do with art, he said.
When we got to his place, it was a rug store. Musa’s friendly onboarding process had worked to get me into the store, penetrating my defenses by using my midwestern politeness against me. We sat down on a nice sofa and Musa served me apple tea; it materialized seemingly out of nowhere, part of a practiced routine. We chatted for about 5 or 10 minutes, sometimes about rugs and sometimes about other things. He told me about watching a TV program that featured this strange street food from NYC: hot dogs. At this point, I was feeling totally suckered, helpless under the thrall of this master salesman. But then I had another thought: this guy is not actually in control of this situation because I’m never in a million years buying a rug from him. Emboldened by my newfound power in our relationship, I thanked Musa politely for the tea, accepted his card, and left to join the line at the cistern.
For dinner on my last night, I sat down at an outdoor table at Meşhur Filibe Köftecisi, figuring that one of the few restaurants where no one was trying to get me to look at a menu was actually a good place to find delicious food. It’s a tiny place on a small street with several other restaurants filled with what looked like locals, another good sign. I asked for a menu but the owner shrugged me off with a friendly gruffness. “We have köfte,” he told me. “Meatballs. Someone like you orders nine. Nine meatballs. Salad to begin. What’s not to like?” I gave him a thumbs up and he yelled something to the chef, an older man who I never saw without a cigarette and had probably made about 10 million köfte over the course of his life.
While I waited for my food, I noticed an order of köfte going out of the kitchen…to a diner at the restaurant across the street. When he was finished, the staff at that place bussed the dishes back across the way. Meanwhile, my meal arrived and the köfte were flavorful and tender and juicy, exactly what I wanted…no wonder the place across the street had outsourced their meatballs to this place. I’d noticed the owner, the waiter, and the cook drinking tea, so after I finished, I asked if I could get a tea. The owner nodded and started yelling to a guy at the tea place two doors down. A few minutes later, a man bearing a tray with four glasses of tea arrived, dropping one at my table and the other three for the staff. Just then, a server from the place across the street came over to break a 100 lira bill. Me being a big nerd, this all reminds me of Unix and the internet, all of these small pieces loosely joined together to create a well-functioning and joyous experience. There’s only one thing on the menu at Meşhur Filibe Köftecisi, but you can get anything else within yelling distance. I declined dessert…who knows where that would have come from.
I also visited the Basilica Cistern (impressive ancient infrastructure), The Blue Mosque (under construction and so underwhelming), Topkapi Palace (underwhelming, but I was pretty museumed out by this point so perhaps an unfair assessment), Taksim Square (very crowded on a Friday night), and walked the length of Istiklal Avenue (very commercial in a Western sort of way).
Getting to my departure flight from Ataturk Airport was the tightest security I have ever gone through. To even enter the airport, you go through a metal detector. Then in the line to check into the flight, my passport was checked by three different people before my boarding pass was issued. Passport & boarding pass were checked again to get into the security line and then went through security, where most people’s bags got searched (but not mine). At the gate, my boarding pass was checked by at least six different people, who each put a different mark or stamp or signature on it, and then my carry-on luggage was searched (mandatory search…everyone got this treatment). Only then were we allowed on the plane. (Upon arrival in Boston, after waiting in a massive line, the border control officer barely glanced at my passport before waving me through.)
I only posted a couple of Istanbul photos on Instagram but posted a bunch of Instagram Stories (collected here). And big thanks to everyone who offered advice on where to go and what to eat. I really enjoyed Istanbul and hope to make it back someday.
In just a few years, Sevilla, Spain went from almost no bike paths and low ridership to robust network of bike paths and many people using them. To do it, the ruling party used the positive results of a public poll to move quickly, annexing 5000 parking spots and spending a relatively meager €32 million to build 80+ kilometers of bike paths in just 18 months.
The year after the basic network opened, Calvo said, it seemed like every family in the city had suddenly bought one another bicycles for Christmas.
“Everyone was talking about the success of the bike lanes at that point,” he said. “The sports shops, they ran out of bikes. They needed to get bikes from Barcelona, from Madrid, and over from France.”
Once that happened, it became clear that the huge bike network investment had been a fiscal bargain.
“The whole network is €32 million,” he says. That’s how many kilometers of highway - maybe five or six? It’s not expensive infrastructure. … We have a metro line that the cost was €800 million. It serves 44,000 trips every day. With bikes, we’re serving 70,000 trips every day.”
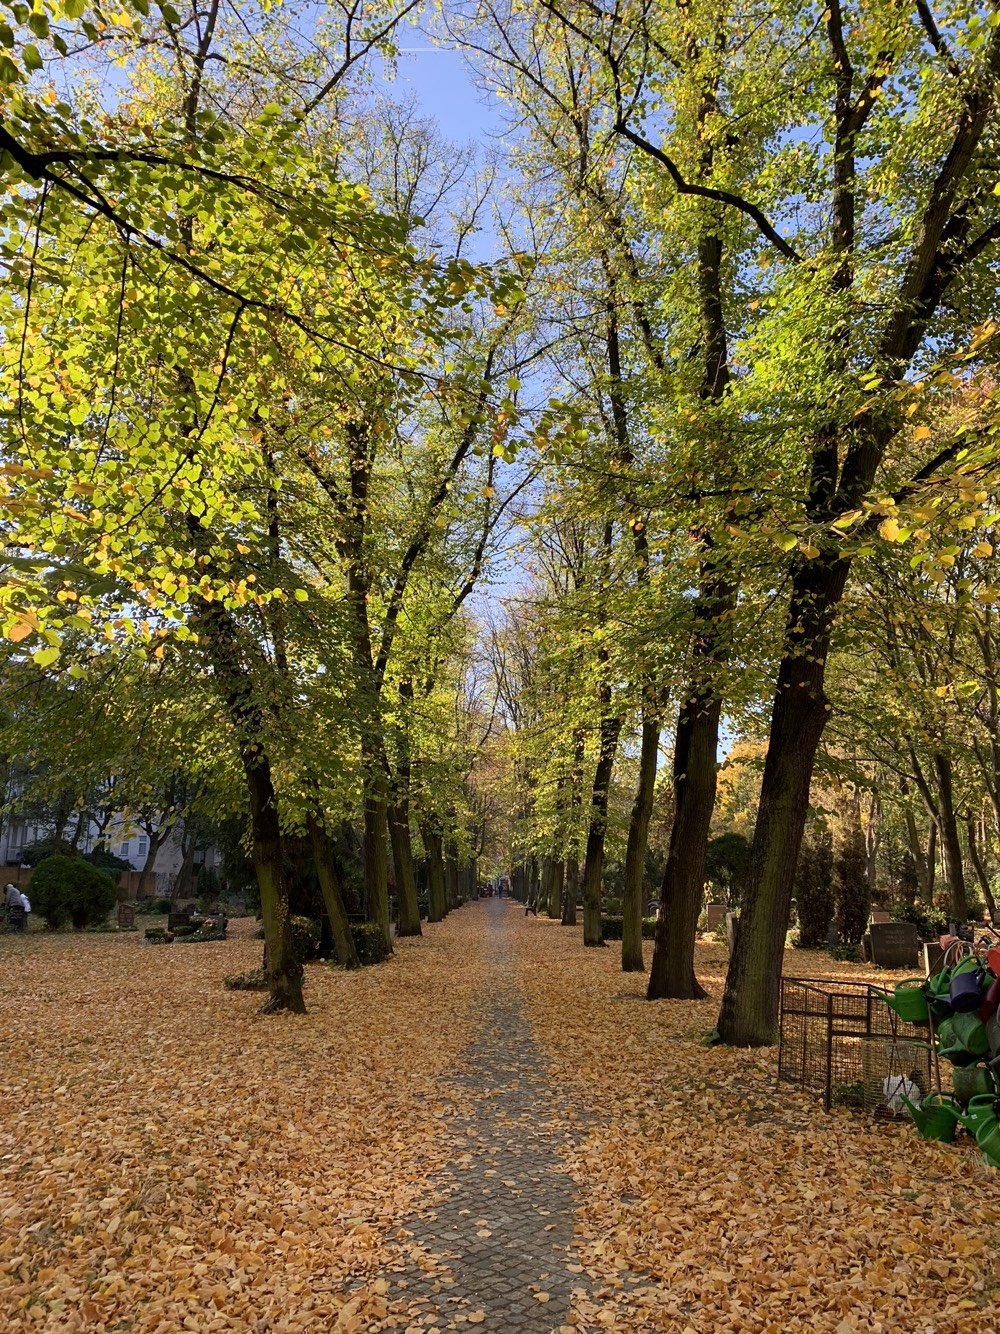
Even for a city almost 800 years old, Berlin has seen more than its fair share of history, especially in the 20th century. Watching the fall of the Berlin Wall on television 29 years ago this month was one of my most memorable experiences as a teen. In 2001, my girlfriend and I visited Berlin, loved it, and wanted to return soon. But you know how that goes sometimes, and I didn’t make it back there for a visit until mid last month, when I spent the better part of a week exploring Germany’s largest city. Here are of my impressions from the trip.
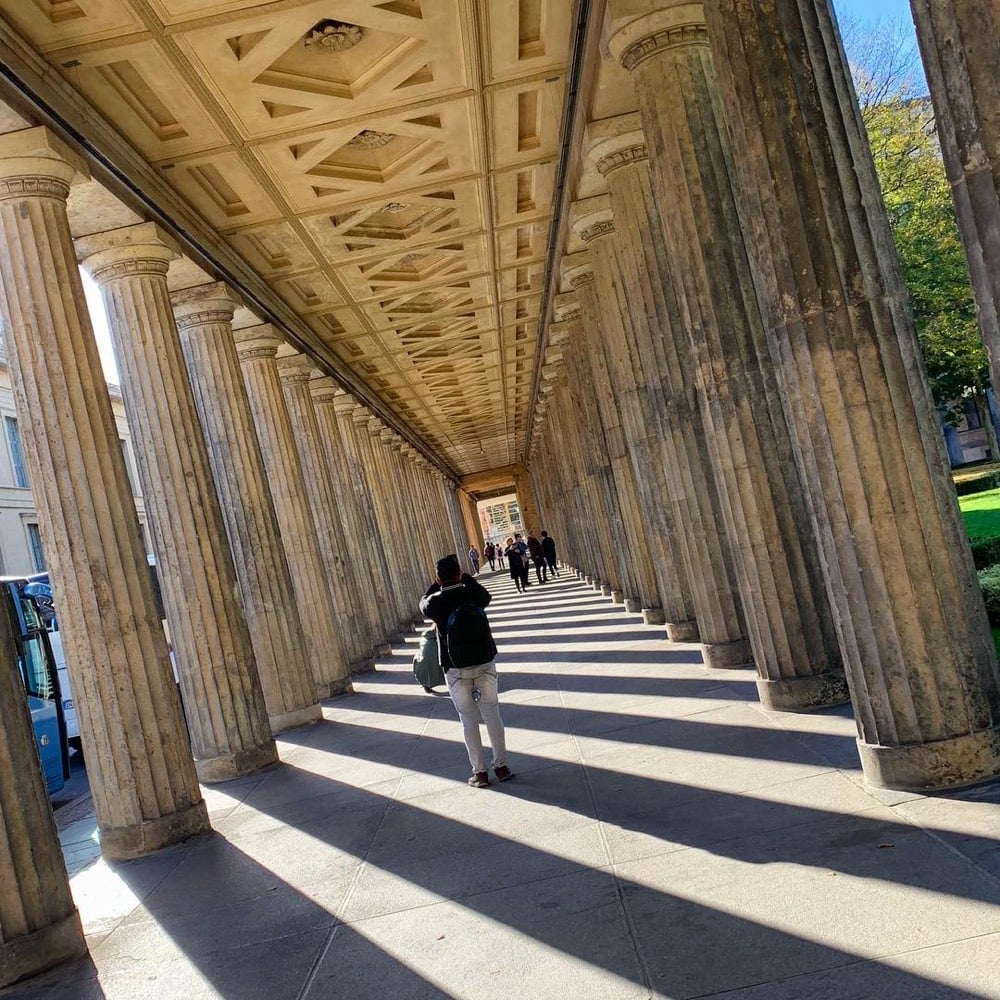
Museum-going is one of my favorite things to do when travelling and Berlin has a bunch of great ones. And they’re not generally these behemoths like the Met or Louvre…they’re reasonably sized places you can knock out in a couple of hours. The recreation of the Ishtar Gate at the Pergamon is one of my favorite things at any museum I’ve been to.
The public transportation in Berlin is great. One ticketing scheme covers buses, trams (in the old East Berlin), surface trains (S-Bahn), and subways (U-Bahn). I bought a weekly pass and used it to travel all over the city. One afternoon with no fixed agenda, I explored by randomly hopping on trams and trains and getting off when things started looking interesting…navigation by an arbitrary stupid goal.
Yes, I had the currywurst. And a kartoffelpuffer (served with a massive dollop of delicious sour cream w/ herbs in it). I preferred the knackwurst I got from Konnopke’s Imbiß and the schnitzel from Scheers, which reminded me a bit of Crif Dogs (but for schnitzel). The guy at Konnopke’s made an “ick” face when I asked for ketchup with my knackwurst instead of mustard. *shrug*
According to Pedometer++, I walked 65 miles over a 7 day period in Berlin.
At the Neues Museum, I read a bit of Homer’s Iliad on a papyrus scroll from more than 2000 years ago. The kids and I have been reading Emily Wilson’s translation of The Odyssey so that was a nice moment of connection across the centuries. (I also saw the bust of Nefertiti there.)
My favorite thing about public transport in Berlin is that instead of having entry turnstiles and swiping your ticket when you get on the bus, you simply buy a ticket and get it stamped on the platform to validate it. That’s it. With my weekly pass, I had to stamp it once to “activate” it, but after that, I could just get on the tram or subway without worrying about it. I love this system…it eliminates so much infrastructure, makes it easier to use public transport, and doesn’t track you around the system like smartcards do. It also makes it easier to ride for free, although there are teams of ticket inspectors moving throughout the system checking for valid tickets. Fines of €60 on up are assessed & paid on the spot.
A team of three undercover ticket inspectors got onto a tram I was riding…they were young, dressed a bit like hooligans, and looked way more like they were gonna steal wallets than officially check tickets. After nonchalantly boarding, they announced themselves to the passengers, pulled out their badges, and worked very quickly, impatiently looking at tickets before the tram pulled into the next stop and scofflaws could escape.
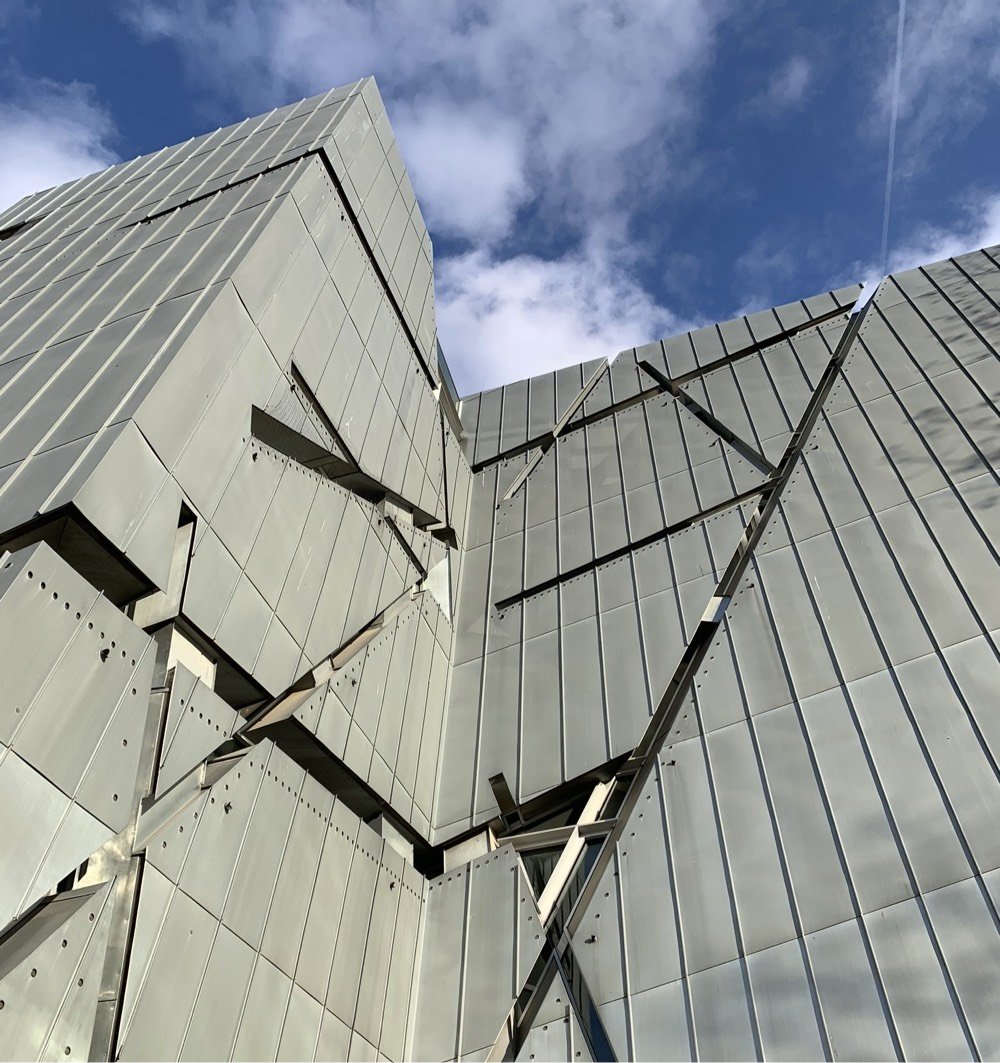
The Memorial to the Murdered Jews of Europe is an open-air memorial of more than 2700 concrete slabs arranged in a grid pattern. While I was there, I saw it being used as a bench, a picnic area, a playground, a hide-n-go-seek maze, a selfie background, a parkour apparatus, and as the backdrop for Instagram influencers…pretty much everything but thoughtful reflection about the murder of 6 million people. See also Yolocaust.
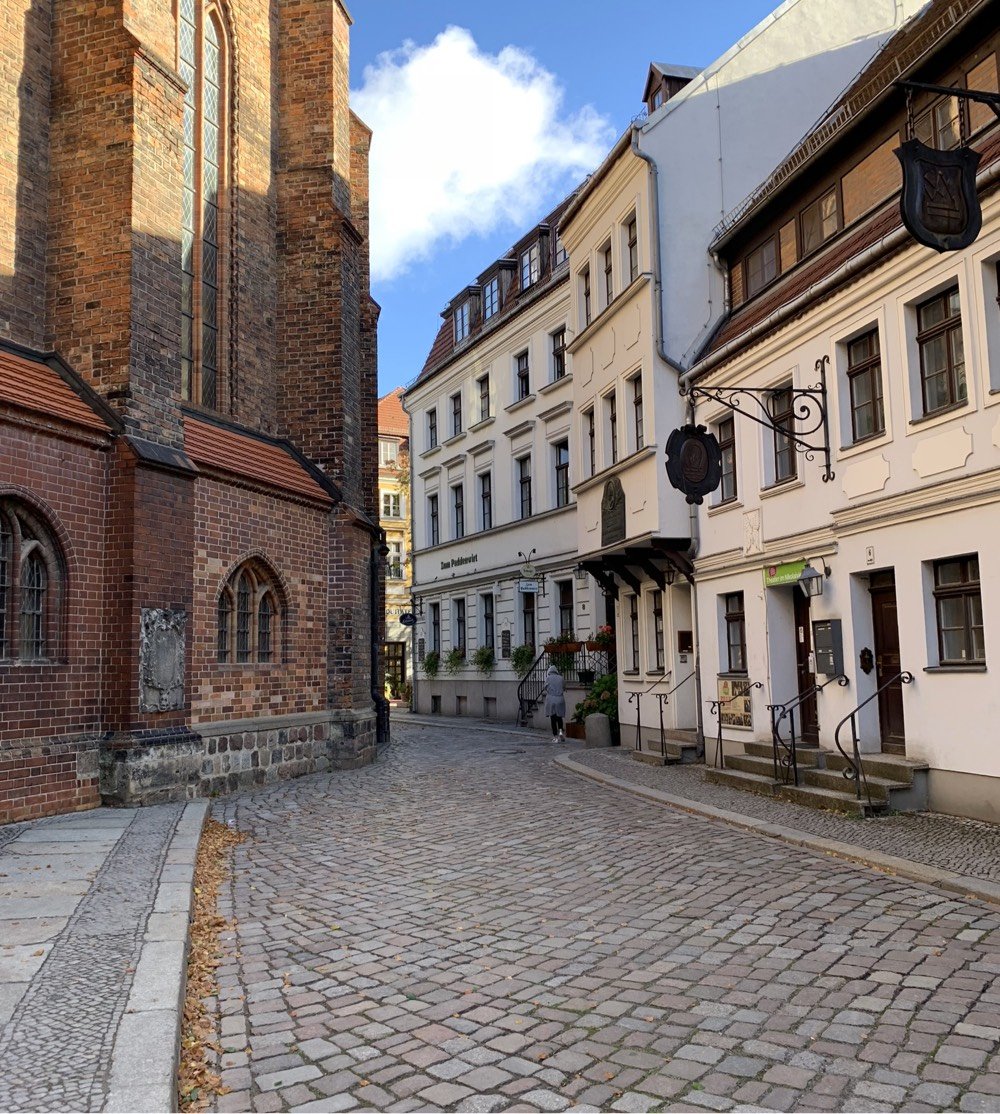
Everyone kept telling me that the city had changed so much since I’d been there, but one of the only differences I could detect was that in 2001, it was pretty easy to tell which parts of the city had been in East Berlin and which had been in West Berlin, just by looking at the buildings and streets. Now, aside from the presence of random Soviet monuments and the tram in the former East Berlin, I couldn’t really tell. After almost 30 years, Berlin finally seems like a single city again (at least to this outsider).
The Deutsches Technikmuseum (German Museum of Technology) is actually huge and completely amazing, especially the collection of trains and train cars housed in the massive buildings of a former railway company. The smell of grease and oil that hit me walking into the exhibition took me right back to when I was a kid, helping my dad fix cars in the garage. As I mentioned in this post, the exhibition included a freight car that was used for transporting Jews to concentration camps that you could walk inside of “and try to imagine, in some small way, you and your children cheek to jowl with 80 other people, on the way to be murdered”. An intense experience.

The massive seven-story KaDeWe department store has an entire floor dedicated to food (in addition to the eatery on the top floor) and the butcher cases must have featured over 120 different kinds of sausage & wurst…it was unbelievable. I spent more than an hour wandering through and ended up having dinner, some scrambled eggs with a side of potatoes and onions — the menu had a disclaimer on the bottom of each page: “Of course our potatoes and onions are made with bacon!” Duh, this is Germany.
The permanent exhibition at the Topographie Des Terrors is a must-see presentation of how the Nazis persecuted, imprisoned, and murdered millions in the 30s and 40s. While sobering and completely gutting in parts, this was one of my favorite things I did in Berlin.
While not quite public transport, Berlin has a thriving bike share scene. I signed up for Mobike because they seemed to have the most inventory. As a bike-friendly city to begin with, there are lots of places on the streets to park these dockless bikes, although locals have complained about bike littering. This was my first time using a dockless bike, and like with WiFi on a laptop or pairing a Bluetooth speaker, the first time feels a little magical.
My favorite meal was at the restaurant in my hotel. That’s a bit of an odd thing to hear because we’re used to hotel restaurants being kind of a default mediocre. But the food at the Michelberger’s restaurant was delicious, surprising, and inventive. I had the burrata w/ pear & dukkah and the arctic char w/ smoked mashed potatoes & buttermilk. Just thinking about that meal is making me hungry!
Berlin reclaimed Tempelhofer Field as a public park after the Tempelhof airport closed in 2008. I’d never walked on a large runway like that before…they’re huge! I was supposed to meet up with Felipe of Fotostrasse to take a more extensive tour of the area, but it was rainy and I was sick, so I only managed a quick solo visit. Next time!
I only posted a couple of pics from Berlin on Instagram, but I did post a bunch of Instagram Stories (collected here). And thanks to everyone on Twitter and Instagram who offered suggestions for my trip! I had a great time and I will definitely be back, hopefully before 17 more years have passed.
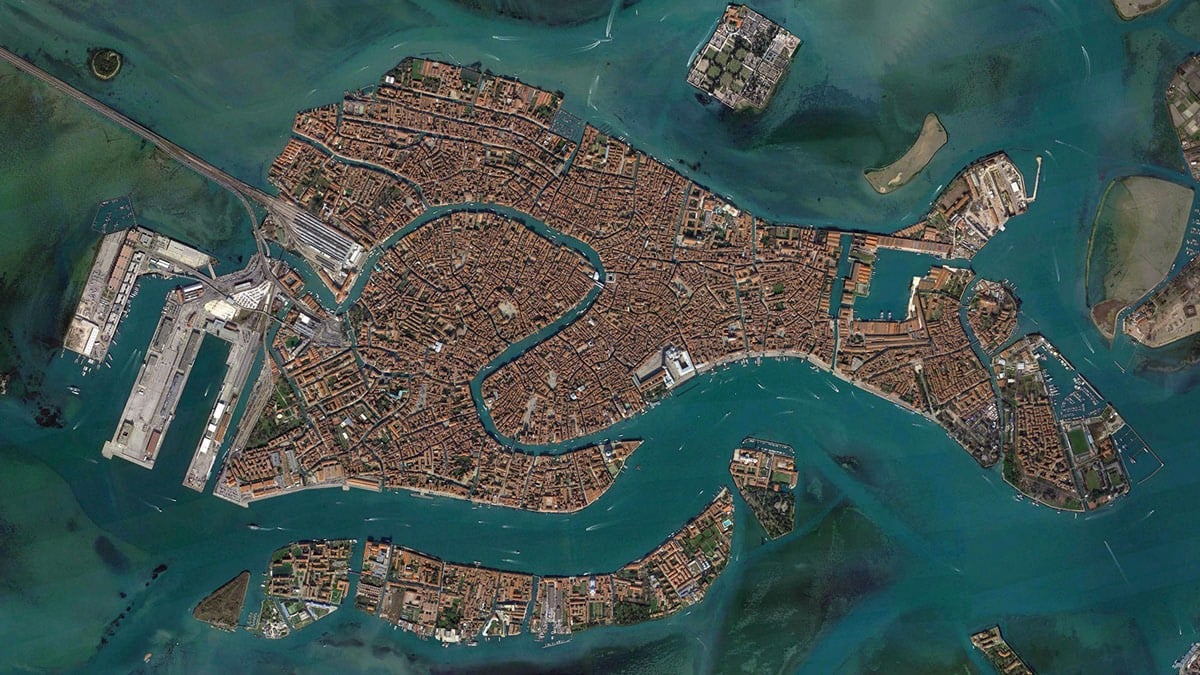
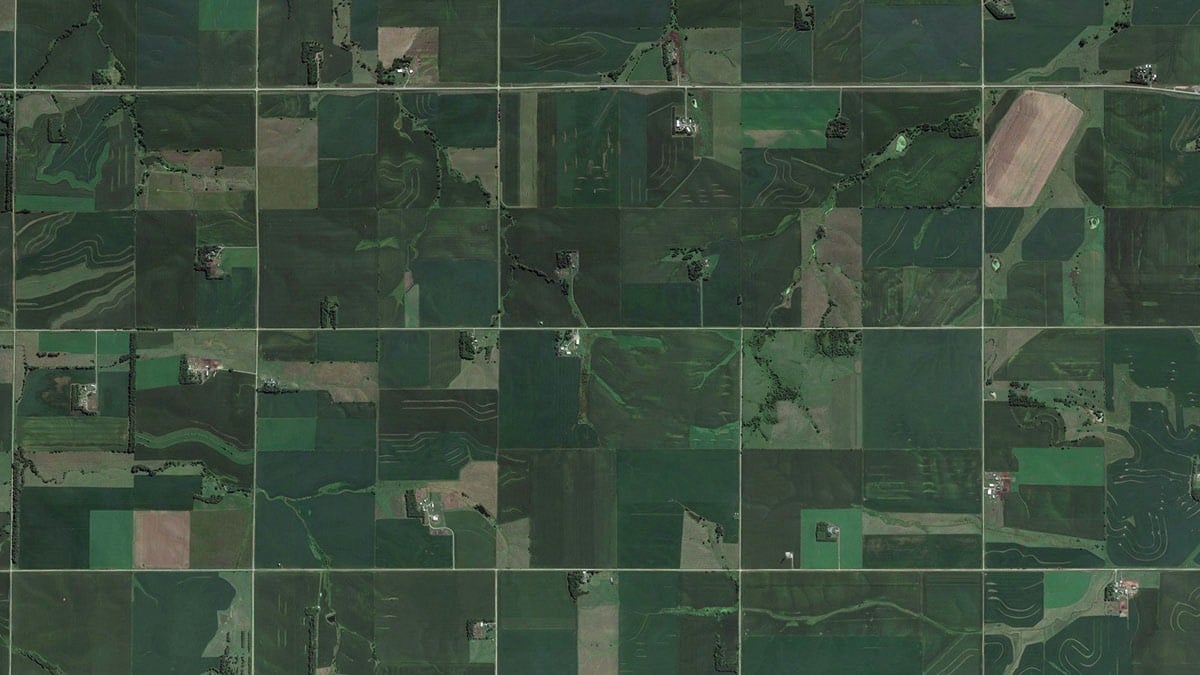
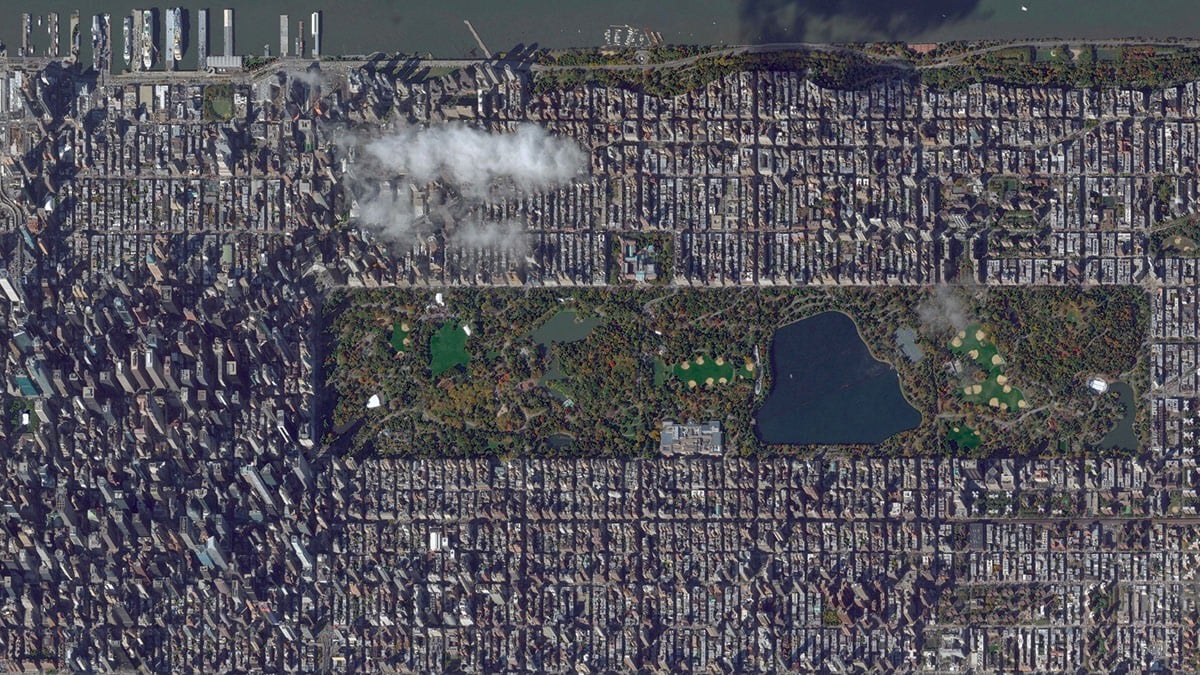
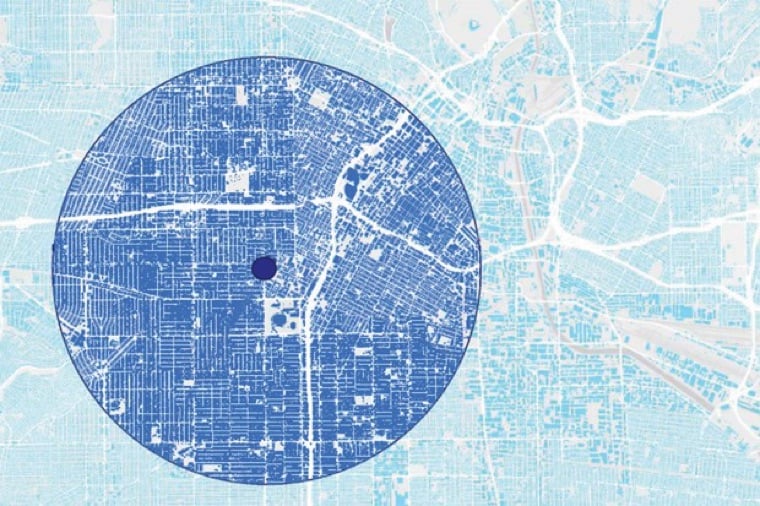
Over at In Focus, still the world’s best photoblog (remember those!?), Alan Taylor is looking at different parts of the world from the same height.
Spending time looking at the varying and beautiful images of our planet from above in Google Earth, zooming in and out at dizzying rates, I thought it would be interesting to compare all of these vistas at a fixed scale-to see what New York City, Venice, or the Grand Canyon would look like from the same virtual height.
Each of the 38 images selected by Taylor shows about seven square miles of the Earth’s surface. The three images I’ve excerpted here are, from top to botton, Venice, Wisconsin farmland, and Manhattan. This planet really is dizzyingly beautiful.
This reminds me of The Jefferson Grid project (showing 1 sq mile satellite photos of the US). There’s another project which I swear I’ve seen recently that shows the grids of streets in cities from around the world and how they vary widely, but I can’t find it. Anyone?
Update: Re: the other project I couldn’t remember, several people sent in Geoff Boeing’s city street orientation project (which I posted about here) but it was probably another project of Boeing’s that I was thinking of: Square-Mile Street Network Visualization. He based the project on the work of Allan Jacobs in Great Streets. (thx, @simiasideris)
I’ve often said that every two-dimensional map is a lie; a perfect map would be able to show a city in three dimensions. (Or four, to show how they’ve changed over time.)
Height tells you so much; the steepness of streets, where water tends to flood, even often class distinctions, at least traditional ones. Try walking around San Francisco sometime, or Gloucester, Massachusetts, following a map that tells you take a left turn, straight uphill. Better still, try this in a wheelchair.
Toby Eglesfield, a graphic designer working in New Zealand, took this challenge seriously. After some aborted attempts with arrows, he settled on a trimetric projection (it’s like isometric, but slightly different), with different colored wedges to indicate the relative steepness of a street. Here’s the basic idea:
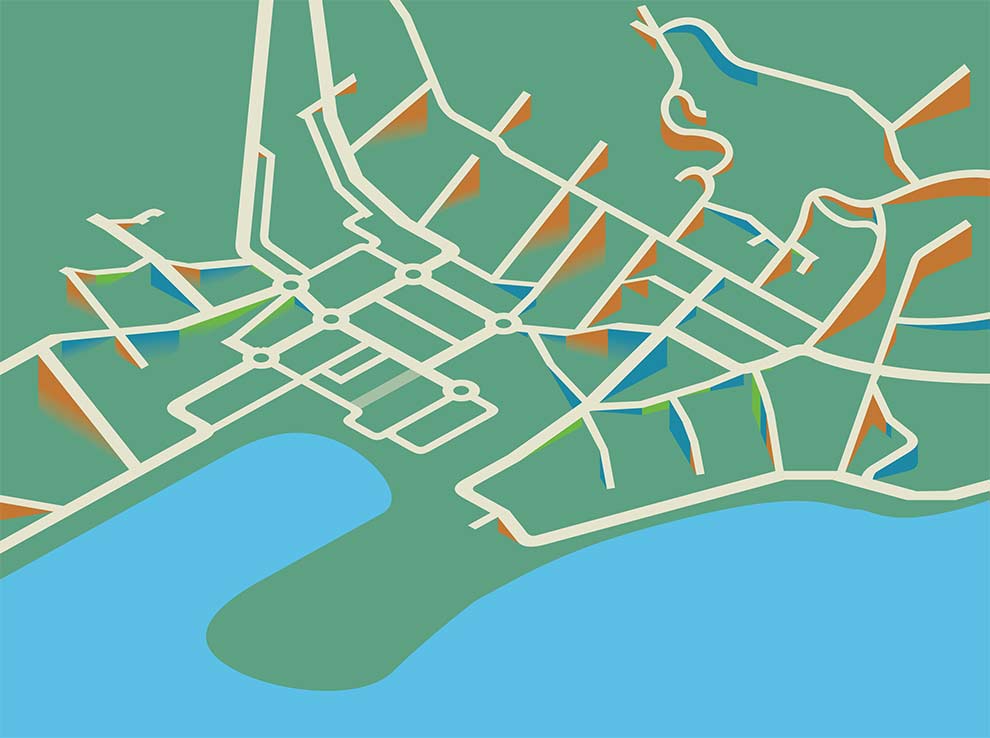
And here’s the completed product:
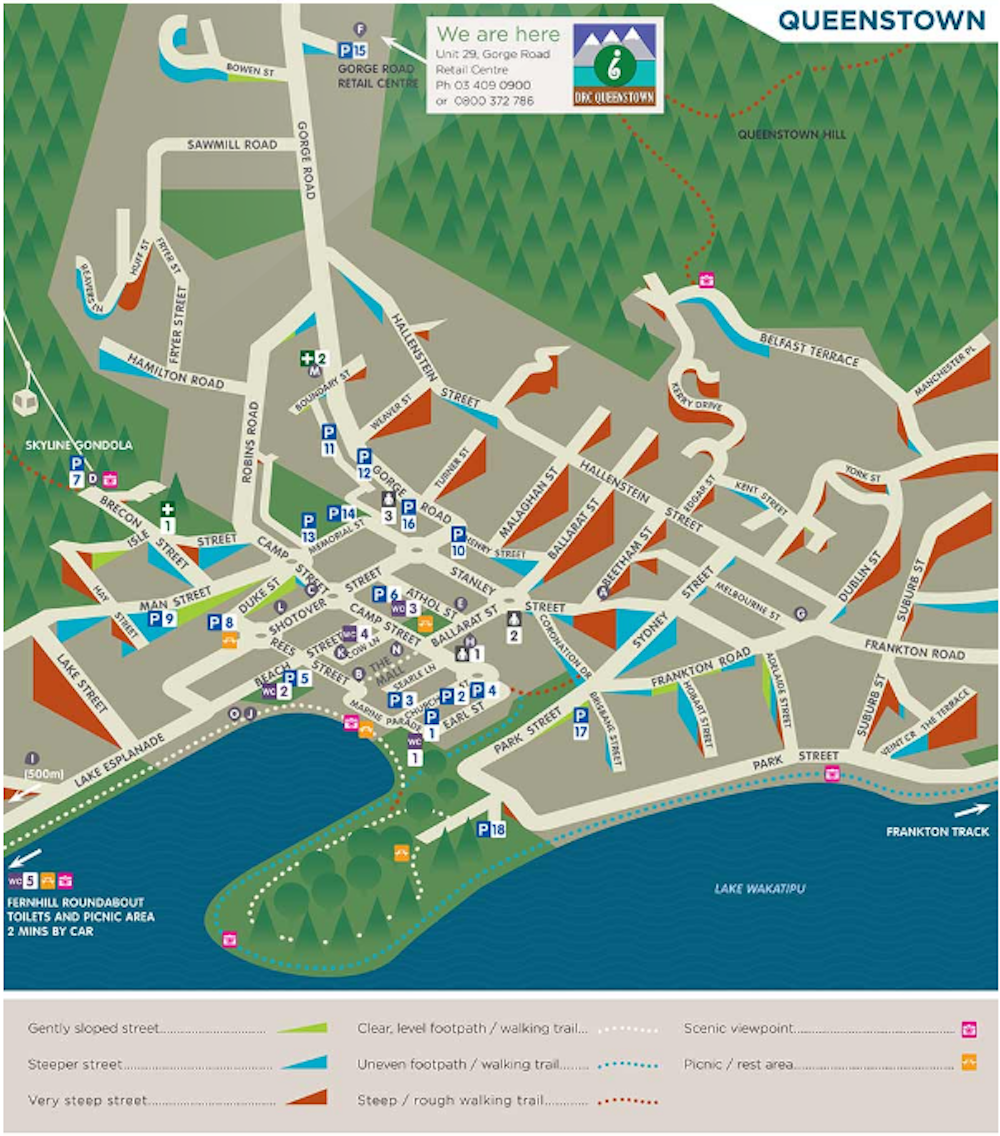
Created for the disAbilities Resource Centre in Queenstown, the map includes marks for accessible toilets, car parks, etc. I’d love to see a version for Manhattan, San Francisco — anywhere, really, but especially older cities with varied topography.
Urban data scientist Geoff Boeing graphed the orientation of the streets in 50 cities from around the world. Here are 10 cities from his analysis:
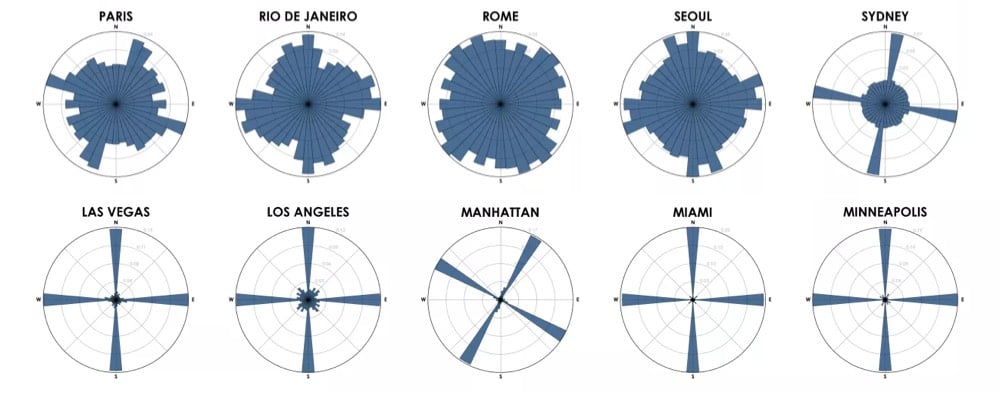
How to read the graphs:
Each of the cities above is represented by a polar histogram (aka rose diagram) depicting how its streets orient. Each bar’s direction represents the compass bearings of the streets (in that histogram bin) and its length represents the relative frequency of streets with those bearings.
Looking at these graphs, you get a real sense of just how planned American cities are compared to much of the rest of the world, where cities grew more organically over longer periods of time. (Although I’m curious to see what the graph for all of NYC would look like…a bit more like Boston perhaps.)
Update: Using Mapbox, you can generate street orientation charts for any map view. I used it to verify that north-south roads outnumber east-west roads in New England, which is why it takes so long to go 30 miles across VT compared to up or down.
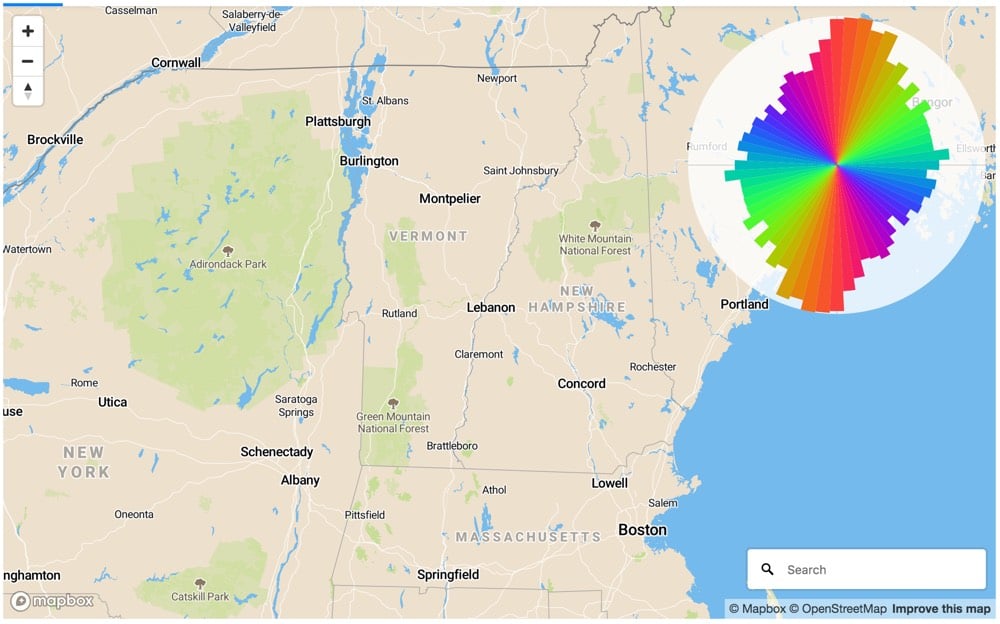
(via @dokas)
Devon Zuegel says that our cities and the people who live in them would be much better off if we designed them around people and not cars.
Unfortunately, America’s inherited infrastructure is more like the old Embarcadero Highway than the boulevard that replaced it. Urban planners spent the 20th century building cities for cars, not people, and alternatives to driving have been systemically undervalued. This legacy has resulted in substandard health outcomes, missed economic opportunities, and a shortage of affordable housing.
We can’t wait around for another earthquake to reverse generations of bad policy. Luckily, it doesn’t require a natural disaster to begin reshaping our infrastructure. Small changes can have an outsized impact in expanding alternatives for how people move around. Rebuilding our infrastructure to enable walking, cycling, and mass transit would bring health and economic benefits that far outweigh its price tag.
People who live in rural areas more or less need their own cars in order to do anything, but private cars in cities are much less necessary. Cities should optimize for buses, subways, cyclists, and pedestrians — they get people to where they’re going without all the outsized infrastructure, waste, and pollution. *repeatedly sticks pin into voodoo doll of Robert Moses*
Update: Alissa Walker writing for Curbed: Don’t ban scooters. Redesign streets. (because there’s still too much space allocated to cars).
Market Street offers a glimpse of how contemporary U.S. cities might be edging towards that shared-street mentality (a proposal to completely ban private cars from the street was ahead of its time). But it also illustrates something else — if you give people ample space to move at a safe speed using the mode of their choice, anyone can use the street.
All over the country, city leaders are spending their summers devoting careful thought to the number of rentable e-bikes that can be deployed on streets at once, where electric scooters might be parked, and how dockless companies should be punished for violating these terms. Just this week, the National Association of City Transportation Officials, which collates best practices from its 62 member cities, released draft guidelines around the regulation of “small vehicles.”
Yet largely absent from these decisions — at least the public-facing ones — are how cities plan to quickly and dramatically reconfigure their streets to allow people to actually use anything but a car.
In The Death of a Once Great City Kevin Baker argues that the current affluence of NYC has made the city “unremarkable” and “boring”.
New York has been my home for more than forty years, from the year after the city’s supposed nadir in 1975, when it nearly went bankrupt. I have seen all the periods of boom and bust since, almost all of them related to the “paper economy” of finance and real estate speculation that took over the city long before it did the rest of the nation. But I have never seen what is going on now: the systematic, wholesale transformation of New York into a reserve of the obscenely wealthy and the barely here — a place increasingly devoid of the idiosyncrasy, the complexity, the opportunity, and the roiling excitement that make a city great.
As New York enters the third decade of the twenty-first century, it is in imminent danger of becoming something it has never been before: unremarkable. It is approaching a state where it is no longer a significant cultural entity but the world’s largest gated community, with a few cupcake shops here and there. For the first time in its history, New York is, well, boring.
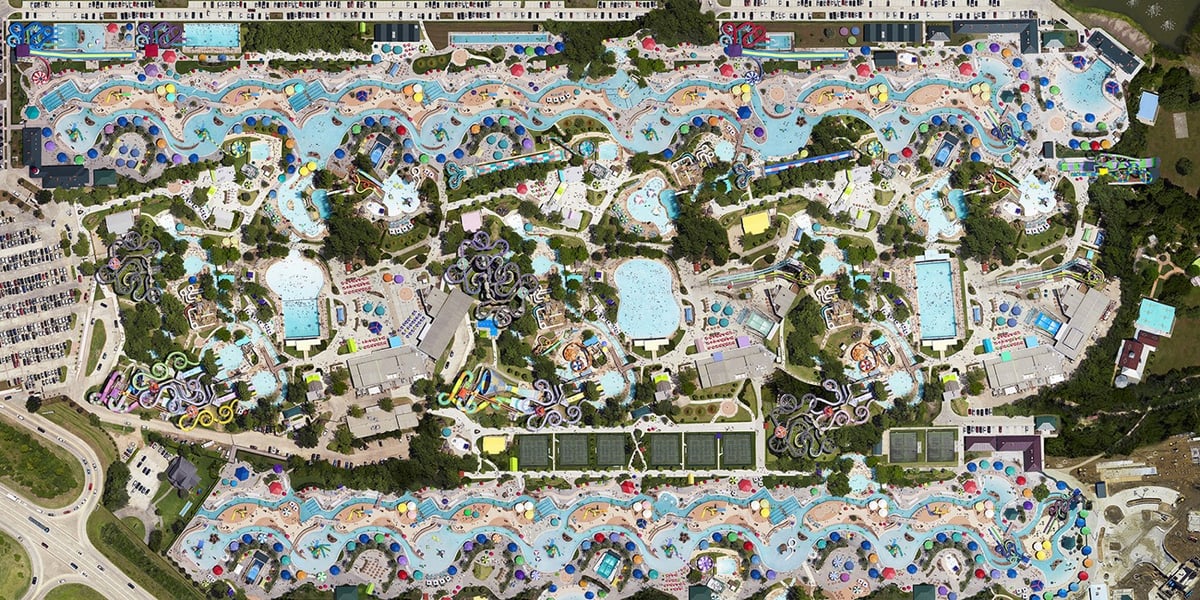
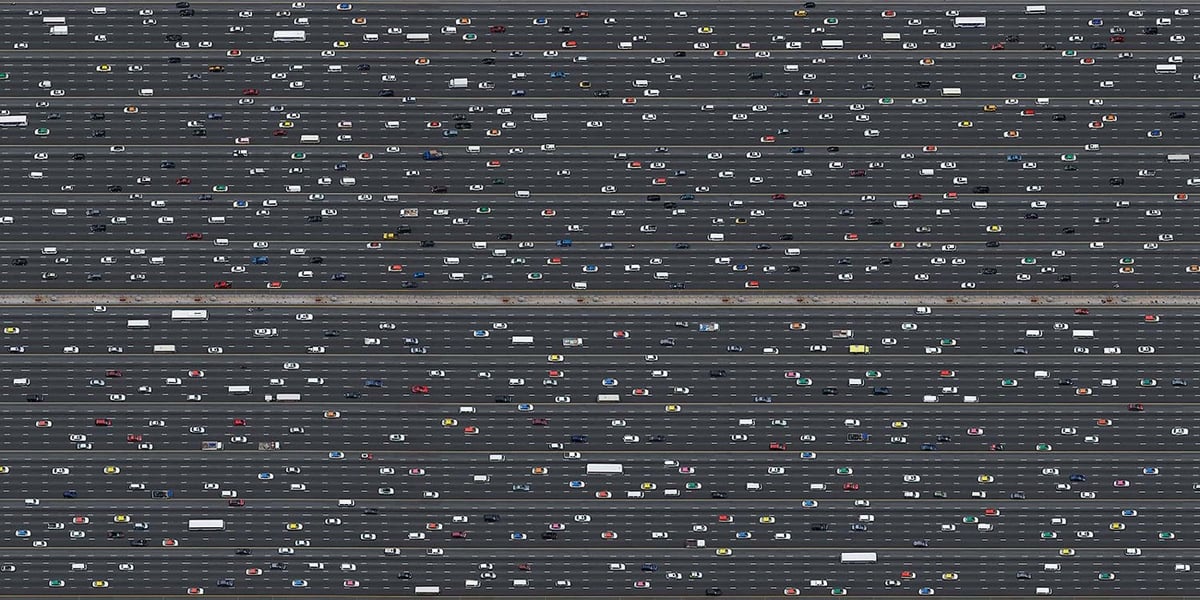
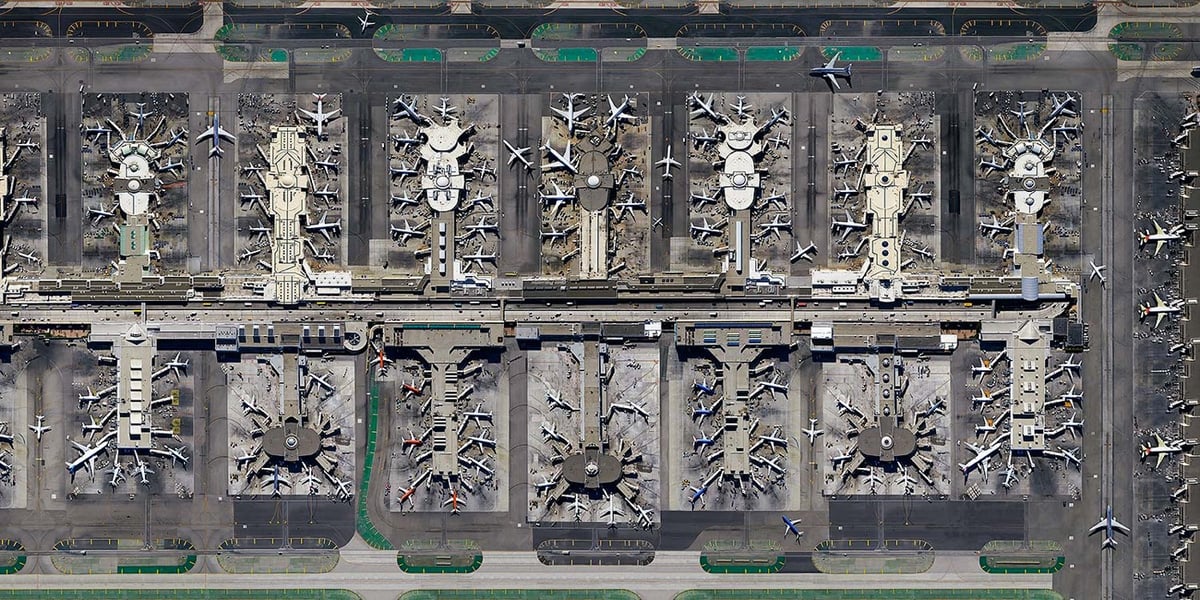
For his projects Exodus and Timeout, Marcus Lyon takes overhead photographs and edits them into fantastical scenes that nonetheless seem plausible. LAX isn’t that large, no waterpark in Houston has that many pools, and Dubai’s roads do not have 70+ lanes, but you kinda have to look at satellite imagery on Google Maps to verify the fabrications.
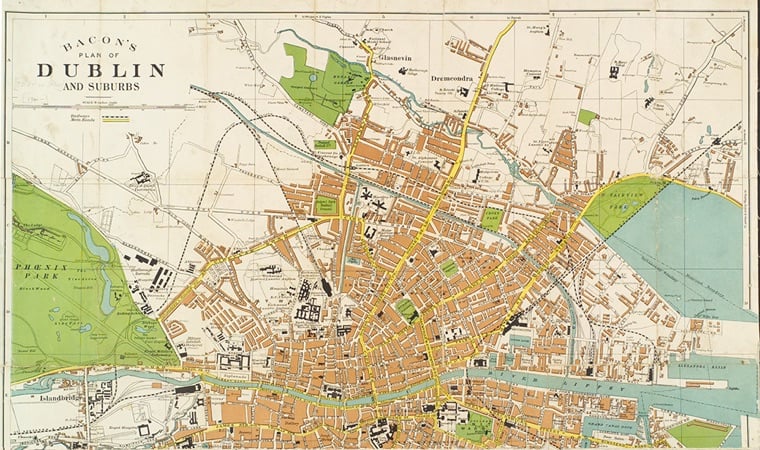
Sometimes, cities are not only the places where stories happen but characters in and of themselves. Here Tyler Malone explores the works of Joyce, Döblin, and Dos Passos and their city centred novels.
These three novels are modernist city novels of the interwar period that move beyond story and character to build structures and trace movements, reconstructing modern metropolises that a world war would soon change forever. Joyce, Dos Passos, and Döblin fashioned not novels but eternal text-cities in which the reader may witness, wander, get lost. […]
Cities are cement and furniture, building and bustle, things that stay still and things that move. Of course, things that stay still in a city can suddenly, and will eventually, move, grow, change, decay, disappear. Buildings crumble, stores go out of business, streets age, accumulating faultlines like faces. Things that move can and do also momentarily pause. A busker stares up at a pedestrian silhouetted by the sun, still as a statue, his last note lingering. The maelstrom of traffic often screeches to a halt.
In fact, those novels are not only city centred but text-cities in themselves:
In other words, Ulysses is not an atlas of Dublin, it is a Dublin; Berlin Alexanderplatz, likewise, is a Berlin. These are not novels; they are cities unto themselves, writ in text of stone and concrete. […]
For the reader-flâneur, linearity isn’t important; it’s about wandering through the text and seeing what one sees, letting the city speak.
—
Also on cities and books; Justin McGuirk reviews at length Richard Sennett’s Building and Dwelling: Ethics for the City on cities as communities, as buildings, and on his vision of open cities.
It also extends to the offices of tech giants like Google, which supply everything a neighborhood has to offer without employees needing to leave the building. Each of these is, for Sennett, a ghetto. Instead, he argues for a city that embraces difference, a place of porous membranes and spatial invitations. […] (emphasis mine)
[The book] has an almost Taoist attachment to harmony and balance. Give architects and planners too much control and the cité suffers; too much faith in the citizen and the ville withers.
(First article via @matthieudugal)
File this story at Citylab adjacent to concepts like complexity, scale, and fractals. It turns out—according to this research paper anyway—that cities’ heat islands function differently depending on the “texture” of the city itself.
[S]cientists know that the density of buildings, the absorption of light by those buildings, and the relative lack of vegetation in cities are major contributors to the urban heat island effect. It’s why cities like Chicago are hoping to find relief through green roofs and reflective construction materials, or through planting more trees and banning cars. In a more radical move, Los Angeles even began painting their roads white as part of Mayor Eric Garcetti’s effort to bring down the city’s temperature by just under 2 degrees over the next 20 years. […]
The difference is even starker at night: even as the temperature cools, the release of heat absorbed during the day by asphalt and densely packed buildings can make the downtown area some 20 degrees warmer in some cities.
Roland Pellenq, a senior research scientist at MIT’s Concrete Sustainability Hub, looked at city grids and the relative positions of buildings, to see if patterns emerge.
Indeed, the fingerprints of cities like Boston and Los Angeles mirror the disorderly atomic structure of liquids and glass, while the likes of Chicago and New York City, with their streets and avenues perpendicular to one another, exhibit a more orderly configuration found in crystals.
Using formulas borrowed from physics, originally developed to measure atomic interaction in condensed materials, they found that more tightly packed cities have more intense heat island effects but also:
[T]hat cities with more rigid grid-like street patterns (that is, a higher local order) tended to display a higher temperature difference between their urban and rural areas. This has to do with air flow, said Pellenq. In disorganized cities, the air tends to flow uniformly with little or no interruption. But the perpendicular streets of Chicago and the like often trap heat by disrupting that airflow.
Fascinating.
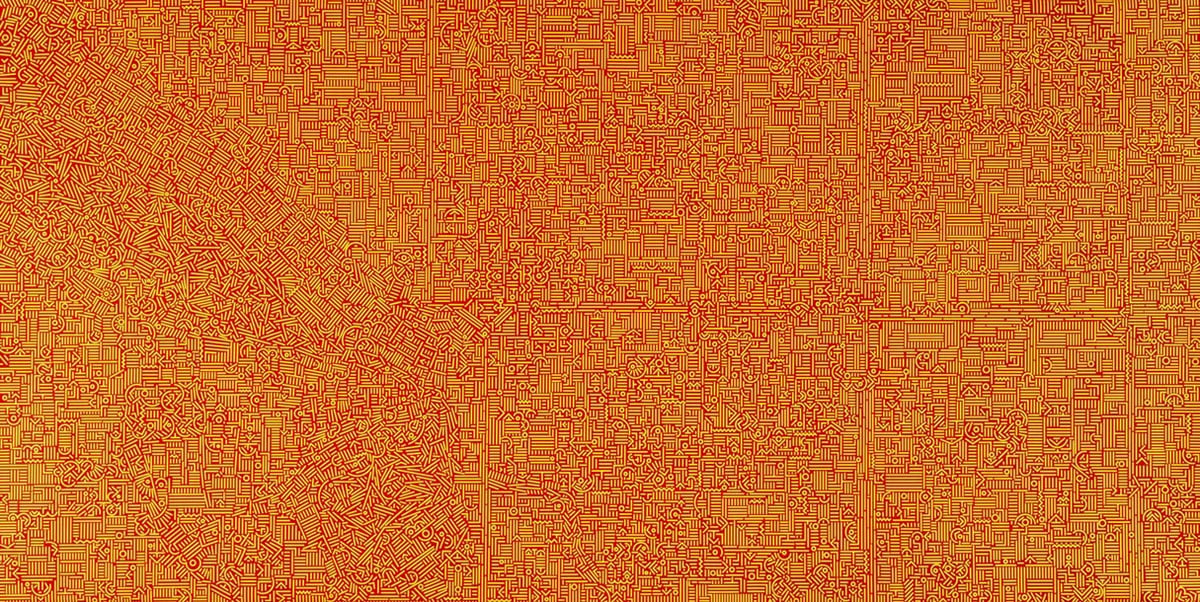
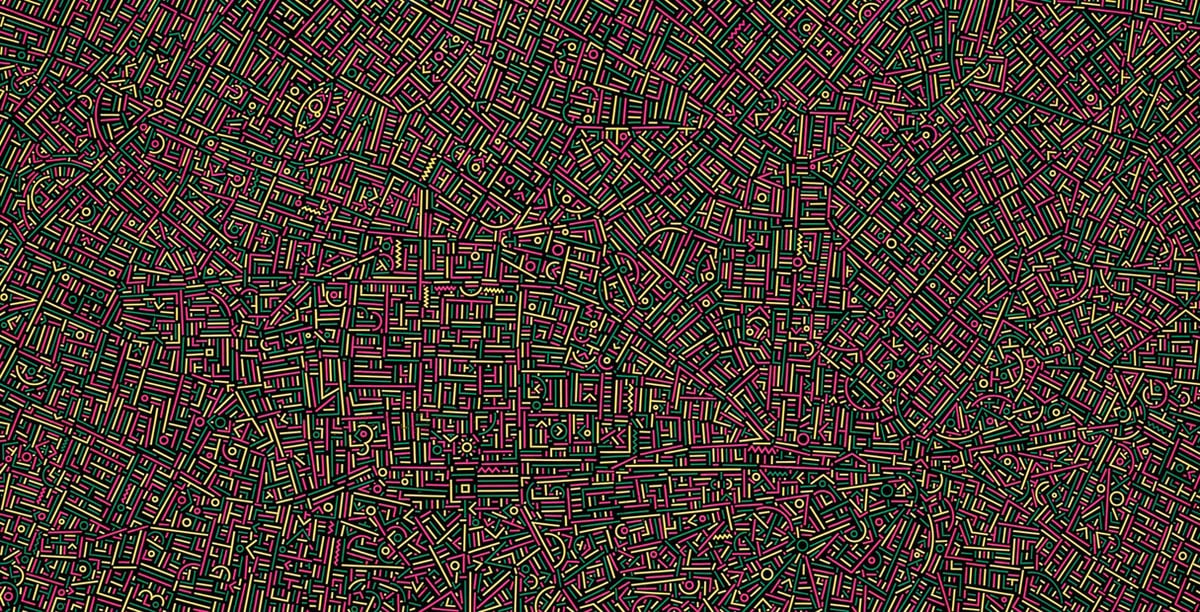
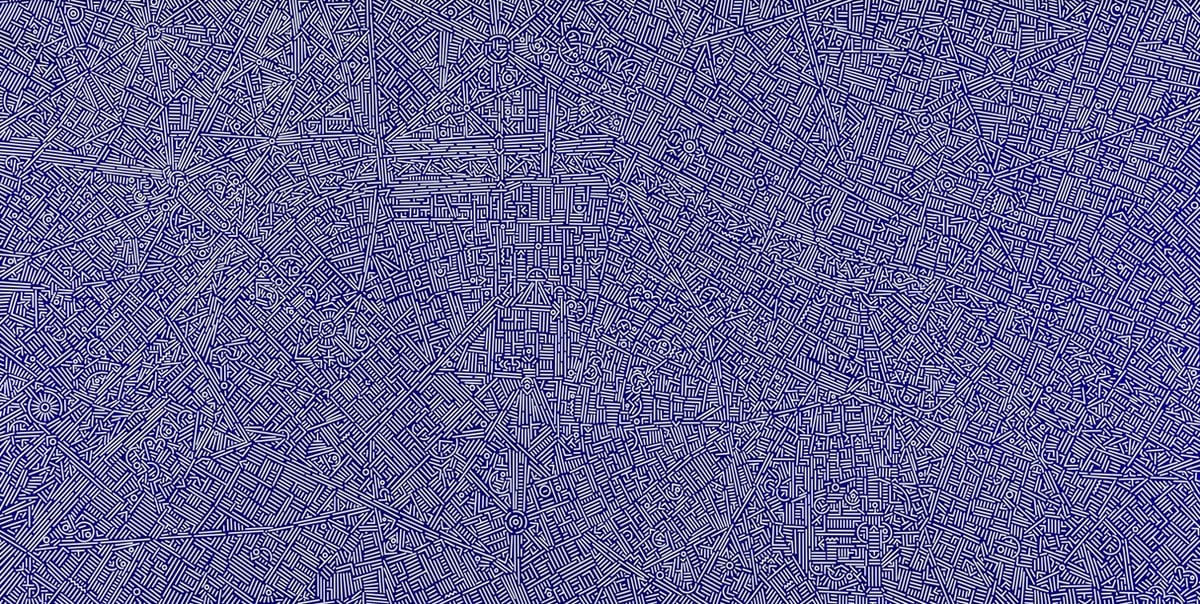
After Piet Mondrian moved to New York in 1940, his work became influenced by Manhattan’s grid system, particularly expressed in Broadway Boogie Woogie. Similarly, for his City DNA project, Xinjian Lu studied satellite maps of cities like Beijing, Athens, New York, and Los Angeles and then created these maze-like paintings that resemble the street layouts of each city. Mondrian++. Holy moly, I *love* these.
From top to bottom, Lu’s paintings depict Beijing, London, and Paris.
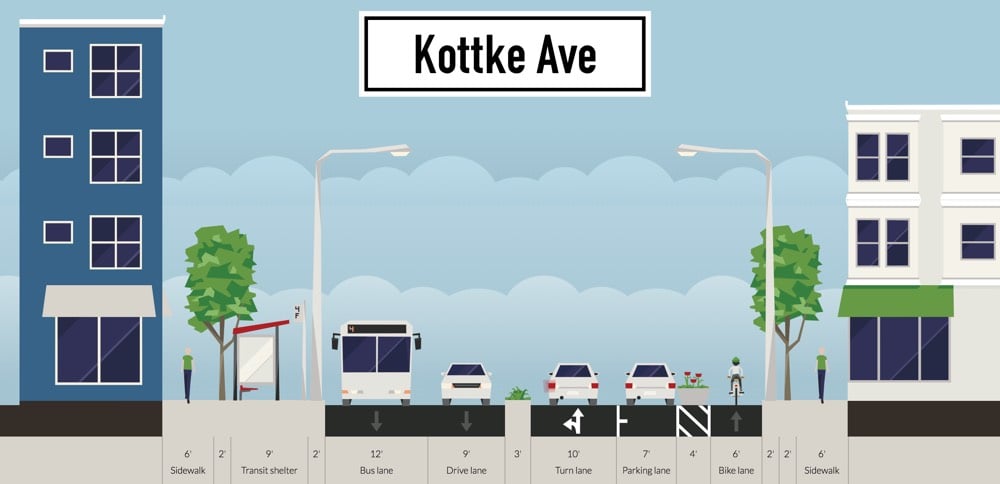
Streetmix is a nifty online street designing tool that lets you play urban transportation planner.
Design, remix, and share your street. Add bike paths, widen sidewalks or traffic lanes, learn how all of this can impact your community.
For instance, you could build a model of the street you live on, add a protected bike lane, a bike rack, or see how a road diet might affect things. You can check out what others have been doing on the Streetmix blog.
A slew of transportation companies, including Uber, Lyft, Zipcar, Didi, and Citymapper recently signed the Shared Mobility Principles for Livable Cities, which are:
1. We plan our cities and their mobility together.
2. We prioritize people over vehicles.
3. We support the shared and efficient use of vehicles, lanes, curbs, and land.
4. We engage with stakeholders.
5. We promote equity.
6. We lead the transition towards a zero-emission future and renewable energy.
7. We support fair user fees across all modes.
8. We aim for public benefits via open data.
9. We work towards integration and seamless connectivity.
10. We support that autonomous vehicles in dense urban areas should be operated only in shared fleets.
This all sounds good, but there’s not a lot of emphasis on public transportation, aside from this (and a couple of other mentions):
The mobility of people and not vehicles shall be in the center of transportation planning and decision-making. Cities shall prioritize walking, cycling, public transport and other efficient shared mobility, as well as their interconnectivity. Cities shall discourage the use of cars, single-passenger taxis, and other oversized vehicles transporting one person.
I remain skeptical that Uber’s ultimate goal isn’t to replace any and every public transportation system it can.
Because of light pollution from urban areas, many people around the world don’t know what the night sky actually looks like. Sriram Murali made a video to illustrate light pollution levels by shooting the familiar constellation of Orion in locations around the US with different amounts of light pollution, from bright San Francisco to a state park in Utah with barely any light at all. In SF, about all you can see are the handful of stars that make up Orion’s belt, arms, and legs. But as the locations get darker, the sky explodes in detail and Orion is lost among the thousands of visible stars (and satellites if you look closely).
This video is a followup to one Murali made of the Milky Way in increasingly dark locations, which is even more dramatic:
But he did the second video with Orion as a reference because many people had no concept of what the Milky Way actually looks like because they’ve never seen it before. Murali explains why he thinks light pollution is a problem:
The night skies remind us of our place in the Universe. Imagine if we lived under skies full of stars. That reminder we are a tiny part of this cosmos, the awe and a special connection with this remarkable world would make us much better beings — more thoughtful, inquisitive, empathetic, kind and caring. Imagine kids growing up passionate about astronomy looking for answers and how advanced humankind would be, how connected and caring we’d feel with one another, how noble and adventurous we’d be.
The measurement scale for sky darkness is called the Bortle scale, as explained by David Owen in his wonderful piece in the New Yorker:
In Galileo’s time, nighttime skies all over the world would have merited the darkest Bortle ranking, Class 1. Today, the sky above New York City is Class 9, at the other extreme of the scale, and American suburban skies are typically Class 5, 6, or 7. The very darkest places in the continental United States today are almost never darker than Class 2, and are increasingly threatened. For someone standing on the North Rim of the Grand Canyon on a moonless night, the brightest feature of the sky is not the Milky Way but the glow of Las Vegas, a hundred and seventy-five miles away. To see skies truly comparable to those which Galileo knew, you would have to travel to such places as the Australian outback and the mountains of Peru.
Nicola Twilley and Geoff Manaugh interviewed Paul Bogard, author of a book on darkness about light pollution and the Bortle scale:
Twilley: It’s astonishing to read the description of a Bortle Class 1, where the Milky Way is actually capable of casting shadows!
Bogard: It is. There’s a statistic that I quote, which is that eight of every ten kids born in the United States today will never experience a sky dark enough to see the Milky Way. The Milky Way becomes visible at 3 or 4 on the Bortle scale. That’s not even down to a 1. One is pretty stringent. I’ve been in some really dark places that might not have qualified as a 1, just because there was a glow of a city way off in the distance, on the horizon. You can’t have any signs of artificial light to qualify as a Bortle Class 1.
A Bortle Class 1 is so dark that it’s bright. That’s the great thing — the darker it gets, if it’s clear, the brighter the night is. That’s something we never see either, because it’s so artificially bright in all the places we live. We never see the natural light of the night sky.
If you’d like to find a place near you with less light pollution, check out The Light Pollution Map. I’m lucky enough to live in a place with a Bortle class of 3 and I’ve visited class 2 locations before…visiting one of the class 1 parks out west is definitely on my bucket list.
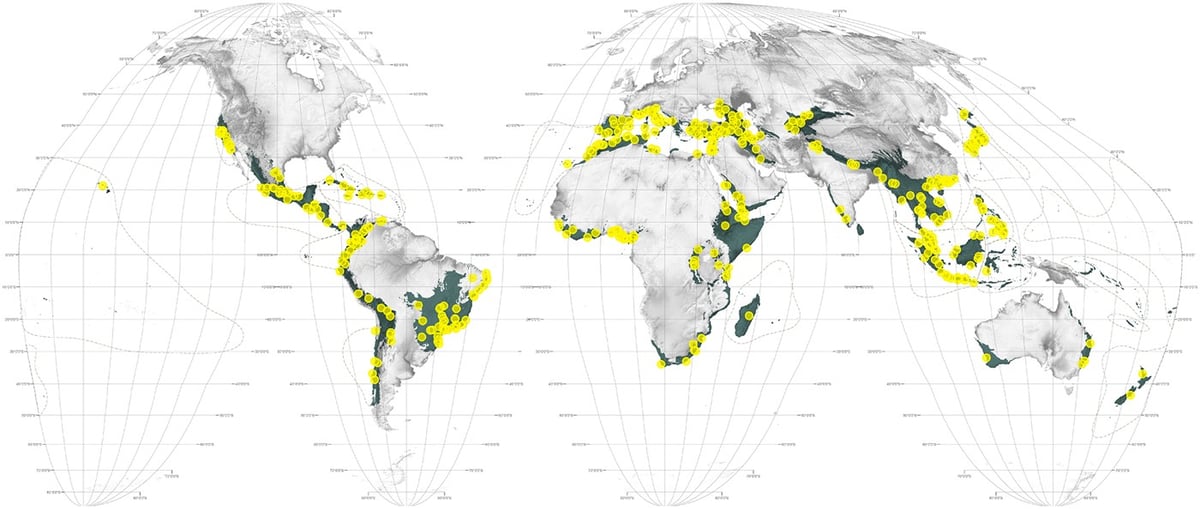
The Atlas for the End of the World is a project started by Penn architect Richard Weller to highlight the effects of human civilization and urbanization on our planet’s biodiversity.
Coming almost 450 years after the world’s first Atlas, this Atlas for the End of the World audits the status of land use and urbanization in the most critically endangered bioregions on Earth. It does so, firstly, by measuring the quantity of protected area across the world’s 36 biodiversity hotspots in comparison to United Nation’s 2020 targets; and secondly, by identifying where future urban growth in these territories is on a collision course with endangered species.
There’s lots to see at the site: world and regional maps, data visualizations, key statistical data, photos of plants and animals that have been modified by humans, as well as several essays on a variety of topics.
And here’s a fun map: countries with national biodiversity strategies and action plans in place. Take a wild guess which country is one of the very few without such a plan in place!
Except for the top three, I’m not sure I could have come up with most of the top 10 largest US cities by population. I’ll give you minute to guess…
…
…
1. NYC
2. LA
3. Chicago
4. Houston
5. Phoenix
6. Philadelphia
7. San Antonio
8. San Diego
9. Dallas
10. San Jose
I dunno, San Antonio at #7 really threw me for a loop. Bigger than Dallas? Bigger than San Francisco (by more than 600,000 people)? Of course, when metropolitan areas are taken into account, the picture changes. The San Antonio area drops to #30 while the Bay Area hits #5.
When I was a kid, the list looked a little different…LA had not yet passed Chicago for #2 and Texas had only two cities in the top 10 (and no Austin creepin’ in 11th place):
1. New York
2. Chicago
3. Los Angeles
4. Philadelphia
5. Houston
6. Detroit
7. Dallas
8. San Diego
9. Phoenix
10. Baltimore
That list still carries more weight in my brain than the current ranking. The facts you learn in school influence how you view your country. And some of those facts, dubbed mesofacts by Sam Arbesman, change slowly, so slowly that you’re tricked into thinking they haven’t changed at all. The average age of the US Senate right now is 62. The version of the population list that many Senators learned in school was probably from the 1950 census (or perhaps the 1960 one) and our current President, at 70 years of age, was possibly taught the list from the 1940 census. The entries on those older lists look much more like the industrial America celebrated by truck and beer commercials and represented by classic baseball and football teams — the America that is to be made great again: Detroit, Cleveland, St. Louis, and Pittsburgh.
Another instructive list to look at in this regard is the list of cities that had populations of at least 100,000 people but have since dropped below that threshold. On the list (with the % drop in parentheses) are:
Canton, Ohio (-39%)
Gary, Indiana (-59%)
Scranton, Penn (-46%)
Flint, Michigan (-50%)
Erie, Penn (-29%)
Utica, NY (-40%)
That the idea embodied by those kinds of cities still holds much sway in American politics shouldn’t be so surprising.
Resurfaced recently by Austin Kleon in his weekly newsletter, I missed this Nov 2016 list from Curbed of 101 books about where and how we live the first time around. The list is organized by category:
Urban Classics includes The Death and Life of Great American Cities*, The Works: The Anatomy of a City*, and Richard Scarry’s Busy, Busy Town*.
Why We Build features Geoff Manaugh’s A Burgler’s Guide to the City* and Building Stories* by Chris Ware.
Cities We Love includes Nonstop Metropolis: A New York City Atlas by Rebecca Solnit, A.J. Liebling’s Between Meals: An Appetite for Paris, and Make Way for Ducklings.
Changing Places highlights The Devil in the White City* by Erik Larson and The Levittowners: Ways of Life and Politics in a New Suburban Community by Herbert Gans.
Planning the Future includes Traffic: Why We Drive the Way We Do (and What It Says About Us)* by Tom Vanderbilt and Annalee Newitz’s Scatter, Adapt, and Remember: How Humans Will Survive a Mass Extinction.
Understanding People features Going Solo: The Extraordinary Rise and Surprising Appeal of Living Alone by Eric Klinenberg, Isabel Wilkerson’s The Warmth of Other Suns*, and Working by Studs Terkel.
And How We Live Today includes The Power Broker* and Robert Putman’s Bowling Alone.
I love the inclusion of Busy, Busy Town and Make Way for Ducklings. Books marked by an asterisk I have read or can otherwise personally vouch for. If I could recommend just one book to read from this list, it would be The Warmth of Other Suns.
This is pretty interesting. Daniel Knowles:
This is Africa’s third biggest city. At 12 million, its population is bigger than London’s. Yet it has almost no connections to the outside world. On normal days, there are only 11 international flights out of Kinshasa per day. At Heathrow, the figure is around 1,400. Apart from the airport, the only other way into this vast megacity is the rickety ferry from neighbouring Congo-Brazzaville. If you were extremely brave, you could try the road to the Atlantic Ocean. But that’s about it. Kinshasa can burn and most of the world doesn’t notice, because Kinshasa is only slightly better connected to the global economy than the North Pole.
And yet somehow it is one of the world’s fastest growing cities. Kinshasa is a particularly extreme example of how Africa is urbanising without globalising. Sixty years ago the whole of sub-Saharan Africa had no cities with a population of more than a million people. Now it has dozens.
But unlike the English peasants who moved to factory cities in the 19th century, or Chinese ones in the 20th, the people moving to African cities are not moving to new global metropolises. Africa’s urbanisation is not driven by economic growth. Instead, people are moving to miserable mega-cities, with crumbling infrastructure and corrupt political systems, and which export almost nothing. Two thirds of Africa’s urban population growth is accounted for by slums. Changing that may well be the biggest challenge facing African governments in the 21st century.
The concept of road diets is an alternate approach to dealing with road congestion that’s gained popularity in recent years. The typical solution to heavy traffic on roads is to widen them with more travel lanes. The problem is such an approach can induce demand and instead of two lanes of traffic jam, you get four lanes going nowhere.1
Instead, with a road diet approach, you might turn a four-lane road into three lanes: two travel lanes and a turn lane in the middle.
Realizing these unintended outcomes, some localities implemented a type of road diet: reconfiguring the four lanes (two in each direction) into three (one each way plus a shared turn lane in the middle). The change dramatically reduced the number of “conflict points” on the road-places where a crash might occur. Whereas there might be six mid-block conflict points in a common four-lane arterial, between cars turning and merging, there were only two after the road diet.
Likewise, at an intersection, eight potential conflict points became four after a road diet.
The result was a much safer road. In small urban areas (say, populations around 17,000, with traffic volumes up to 12,000 cars a day), post-road diet crashes dropped about 47 percent. In larger metros (with populations around 269,000 and up to 24,000 daily cars), the crash reduction was roughly 19 percent. The combined estimate from all the best studies predicted that accidents would decline 29 percent, on average, after a four-to-three-lane road diet — DOT’s reported figure.
Pedestrian and bike usage tends to increase as well (b/c that extra street can be converted to bike lanes or sidewalks), speeding decreases, and car travel times are largely unaffected. This quick video by Jeff Speck shows four different approaches to road dieting:
Update: See also Braess’ paradox.
Braess’ paradox or Braess’s paradox is a proposed explanation for a seeming improvement to a road network being able to impede traffic through it. It was discovered in 1968 by mathematician Dietrich Braess, who noticed that adding a road to a congested road traffic network could increase overall journey time, and it has been used to explain instances of improved traffic flow when existing major roads are closed.
The paradox may have analogues in electrical power grids and biological systems. It has been suggested that in theory, the improvement of a malfunctioning network could be accomplished by removing certain parts of it.
(thx, david)
Update: A street in Oakland recently underwent a road diet: two of five lanes were converted into protected bike lanes. The result is an increase in biking and pedestrian use, a decrease in collisions, a decrease in speeding, and an increase in business along the street.
Along nine blocks of Oakland’s Telegraph Avenue, biking is up 78 percent since protected bike lanes were installed. Walking is up 100 percent - maybe because, thanks to the single lane of through traffic in each direction, the pedestrian yield rate doubled in the mornings and tripled in the afternoons.
Meanwhile, the number of traffic collisions fell 40 percent. Retail sales in a district that has sometimes struggled are up 9 percent, thanks in part to five new businesses.
And the median car speed is now the speed limit: 25 mph. As usual on such projects in urban areas, the main effect of removing a car passing lane was not to jam traffic, only to prevent irresponsible drivers from weaving between lanes in order to get to the next stoplight more quickly.
Citizen Jane: The Battle for the City is a documentary films about Jane Jacobs and her legendary battle against Robert Moses for the soul of New York City.
People have to insist on government trying things their way.
The film will be available in theaters and on-demand on April 21.
I’m a bit more than halfway through the audiobook of The Power Broker and Robert Moses is approaching the height of his influence. The power that Moses possessed in NYC almost cannot be overstated — I can’t think of any other single person who affected the “look and feel” of the city more than he did. I have heard the story many times, but I can’t wait to get the part with Jacobs, to hear in Caro’s words how this infinitely powerful man lost his grip on the city because of this remarkable woman and a group of concerned citizens. (via @daveg)
Update: Astoundingly, Jacobs is not in The Power Broker. Her chapter was cut for length. (thx, alec)
It makes sense that villages and towns would develop a short distance away from each other so that people living nearby wouldn’t have to travel far to sell their goods, bank, or go to school. But what about cities? Geography has a lot ot do with where cities are located.
If you enjoy this video but haven’t read Jared Diamond’s Guns, Germs, and Steel yet, you probably should.
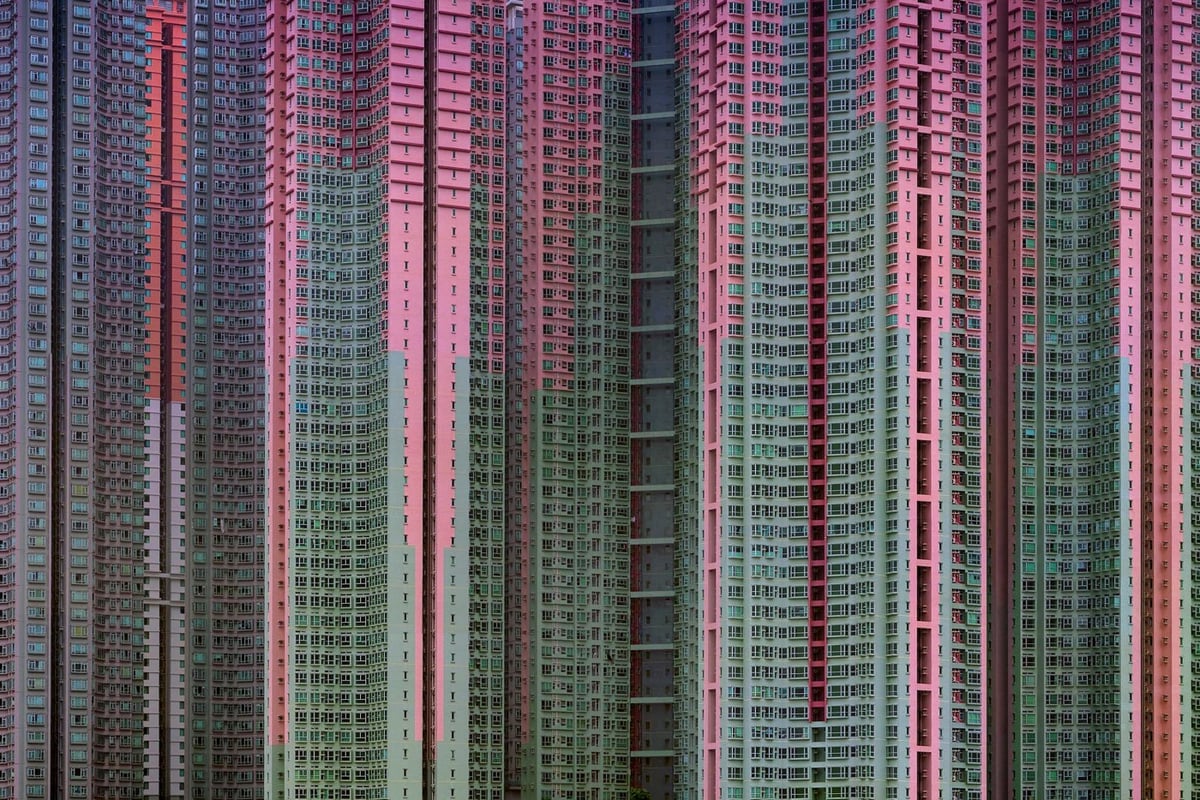
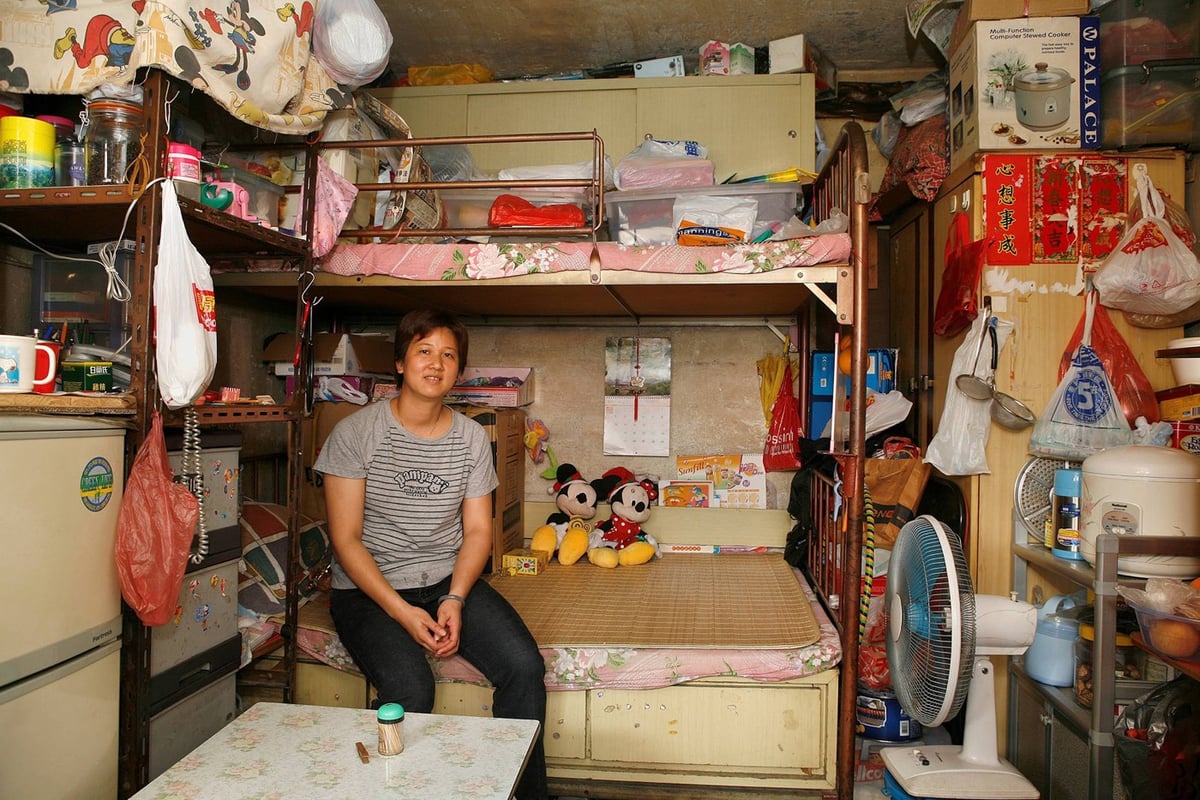
I’ve featured the work of photographer Michael Wolf here before, particularly his series of photos taken in Hong Kong called Architecture of Density, photographs which capture the immense scale of the city’s apartment buildings and the smallness of the apartment they contain. Another of his projects is 100x100, interior photographs of 100 Hong Kong dwellings that measure 100 square feet or less in size. (See also Hong Kong Cage Homes.)
In this pair of videos, Wolf discusses these projects and a couple of other ones I hadn’t seen before.
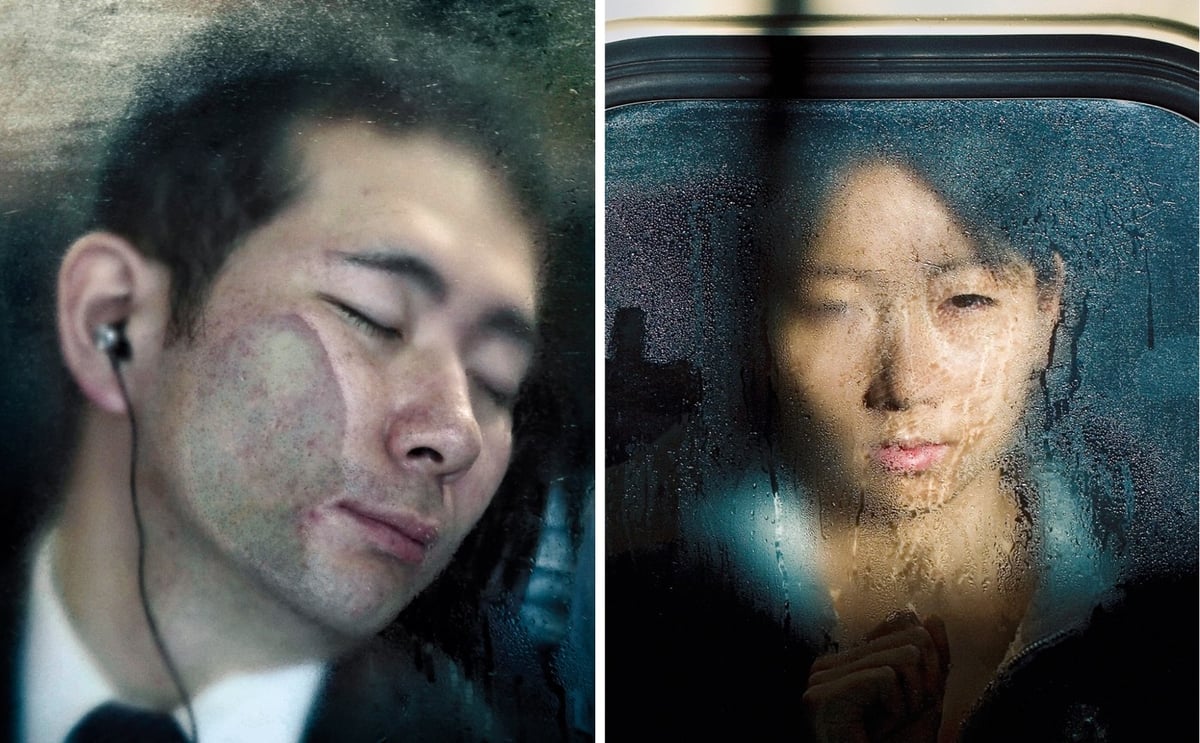
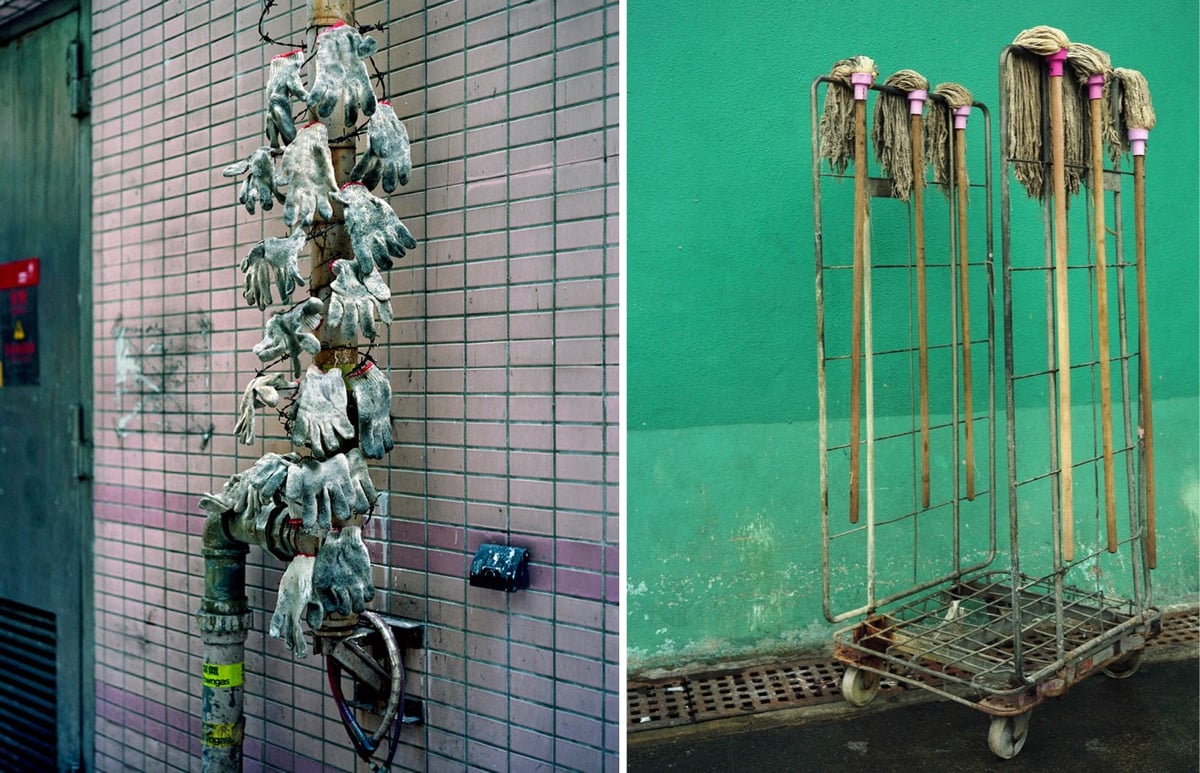
In Tokyo Compression, Wolf captures the boredom and despair of Japanese train commuters, smushed into cars dampened by the heat of humanity. For Back Door, he ventured into the alleys of Hong Kong and witnessed people using the infrastructure of the city for storing, sorting, and drying all sorts of things, from after-work clothes to mops to lettuce. (via craig mod)
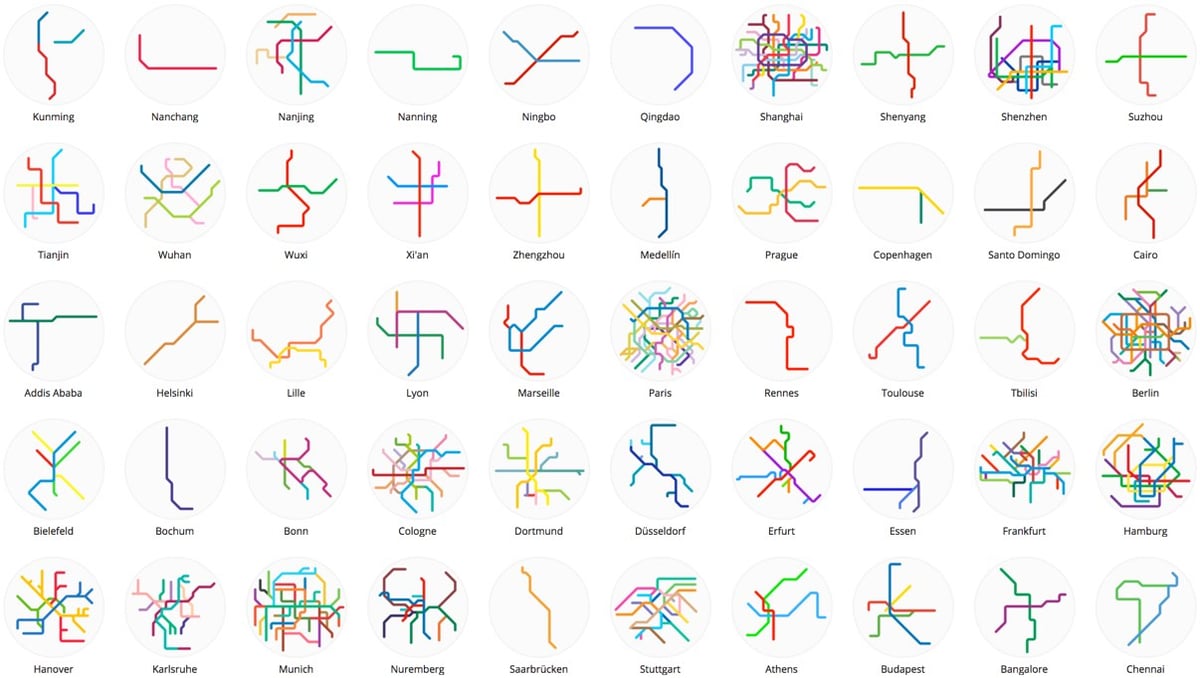
Mini Metros features small and simplified maps of over 200 metro and light rail systems from around the world. Many of the systems are small and simple themselves, just a single line or two, like in Edmonton, Mumbai, Seville, and Qingdao. Others, like in Munich, Shanghai, Tokyo, London, Seoul, and New York, are densely interconnected.
Prints and mugs are available.
Collaborating with a number of different people from all over the place, filmmaker Oscar Boyson went out into the world and came back with this excellent 18-minute video on the future of cities. Among the cities profiles are Shenzhen, Detroit, Singapore, NYC, Copenhagen, Seoul, Lagos, and Mumbai.
What does “the future of cities” mean? To much of the developing world, it might be as simple as aspiring to having your own toilet, rather than sharing one with over 100 people. To a family in Detroit, it could mean having non-toxic drinking water. For planners and mayors, it’s about a lot of things — sustainability, economy, inclusivity, and resilience. Most of us can hope we can spend a little less time on our commutes to work and a little more time with our families. For a rich white dude up in a 50th floor penthouse, “the future of cities” might mean zipping around in a flying car while a robot jerks you off and a drone delivers your pizza. For many companies, the future of cities is simply about business and money, presented to us as buzzwords like “smart city” and “the city of tomorrow.”
A few tidbits from the video to whet your appetite:
- An estimated 70% of the world’s population will live in urban areas by 2050. (It’s currently 54%.)
- Buying a Toyota Corolla in Singapore costs $140,000.
- In 2012, 52% of the cost of US highways and roads was paid by general tax revenue rather than by drivers (through gas tax and tolls). In 1972, it was only 30%, which means car usage is much more heavily subsidized than it used to be.
- When you buy a car in Denmark, you pay a 150% tax, even if it’s electric.
- And a relevant quote from Jane Jacobs’ The Death and Life of Great American Cities: “Lowly, unpurposeful, and random as they may appear, sidewalk contacts are the small change from which a city’s wealth of public life may grow.”
And boy, listening to Janette Sadik-Khan talk about cities being for people and the importance of public transportation and then, directly after, having to listen to some dipshit from Uber was tough. (via @mathowie)
In a short essay from Literary Hub titled New York is a Book Conservatives Should Read, Rebecca Solnit writes an open letter to Donald Trump urging him to take some lessons from the city in which he lives. Solnit argues that Trump’s wealth has insulated him from experiencing one of the true pleasures of American cities like New York: energetic and meaningful diversity.
You treat Muslims like dangerous outsiders but you seem ignorant of the fact that the town you claim to live in has about 285 mosques, and somewhere between 400,00 and 800,000 Muslims, according to New York’s wonderful religious scholar Tony Carnes. That means one out of ten or one out of twenty New Yorkers are practitioners of the Islamic faith. A handful of Muslims, including the Orlando mass murderer, who was born in Queens, have done bad things, but when you recognize how many Muslims there are, you can stop demonizing millions for the acts of a few.
NYC is only one-third white and is home to hundreds of thousands of Muslims and Jews and millions of blacks, Latinos, and Asians.
Speaking of African-Americans: have you ever been to Harlem or the Bronx? You keep talking about black people like you’ve never met any or visited any black neighborhoods. Seriously, during that last debate you said, “Our inner cities are a disaster. You get shot walking to the store. They have no education. They have no jobs. I will do more for African-Americans and Latinos than she can ever do in ten lifetimes. All she’s done is talk to the African-Americans and to the Latinos.” Dude, seriously? Did you get this sense of things from watching TV-in 1975?
Solnit wrote the piece after compiling her most recent book, Nonstop Metropolis: A New York City Atlas.
Bringing together the insights of dozens of experts — from linguists to music historians, ethnographers, urbanists, and environmental journalists — amplified by cartographers, artists, and photographers, it explores all five boroughs of New York City and parts of nearby New Jersey. We are invited to travel through Manhattan’s playgrounds, from polyglot Queens to many-faceted Brooklyn, and from the resilient Bronx to the mystical kung fu hip-hop mecca of Staten Island.
This NY Times piece on the political inclinations of rural areas vs cities is an interesting companion to Solnit’s letter.
“There is something really kind of strange and interesting about the connection between peoples’ preferences — what they view as the good life, where they want to live — and their partisanship,” said Jonathan Rodden, a political scientist at Stanford. His precinct-level maps of presidential election results show deep blue in the densest, central parts of metropolitan areas, where you’d find the Main Streets, city halls, row homes and apartment buildings. The farther you travel from there, the redder the precincts become. And this is true whether you look around New York City or Terre Haute, Ind.
Martin Pedersen recently reread Jane Jacobs’ The Death and Life of Great American Cities and came away with ten lessons.
3. Jacobs was remarkably prescient on gentrification.
She didn’t invent the term or even use it. But she observed (and I don’t know how, since most cities were in decline at the time) that lively diverse neighborhoods are always at risk for becoming victims of their own success, because newcomers invariably alter the characteristics that made these neighborhoods appealing to them in the first place. Today this seems obvious and self-evident, but that’s largely because of Jane Jacobs.
Yeah, it’s time for a reread…it’s been more than 12 years for me. (via @michaelbierut)
Whoa, this is the coolest! Jason Wright’s Brand New Subway allows players to alter the NYC subway system as they see fit. You can start with existing maps and the choices you make affect ridership and the price of a Metrocard.
Players can choose to start from scratch or one of several NYC subway maps (including present-day, maps dating back to the early 1900s, or maps from the future). They can build new stations and lines to expand the system to new areas, or tear it down and redesign the whole thing. The game intends to evoke an imaginative spirit, to empower people to envision transportation according to their needs and desires, and to arouse the fun of tinkering with maps.
This project is an entry in The Power Broker Game Design Competition, the goal of which is to adapt Robert Caro’s The Power Broker into a playable experience. Wright explains how his game hits the mark:
Bottom-up vs. top-down design. Moses was infamous for his top-down approach to urban planning. He held “the public” as a concept in high regard while simultaneously showing contempt for the individuals who made up that public, in the form of arrogance, spitefulness, and an utter lack of concern for the millions displaced for his expressways and parks. Later on in his career, as the span of his projects increased, Moses would make monumentally important decisions about the fate of a neighborhood without once setting foot there. He was known for building 13 bridges and hundreds of miles of parkways despite never driving a car.
Although Brand New Subway might appeal to someone who enjoyed SimCity but who has never set foot in New York City, it’s targeted primarily at those who actually ride the subway and who might feel invested in what they design. In that regard, it inverts Moses’ paradigm by encouraging players to improve on transportation in their own neighborhoods and in ways to which they have a personal connection.
I reeeeeeally didn’t want to spend the rest of my day playing with this, but that super express train from Manhattan to JFK isn’t going to build itself! (via @byroncheng)
Newer posts
Older posts
Socials & More