Making useful three-dimensional maps
I’ve often said that every two-dimensional map is a lie; a perfect map would be able to show a city in three dimensions. (Or four, to show how they’ve changed over time.)
Height tells you so much; the steepness of streets, where water tends to flood, even often class distinctions, at least traditional ones. Try walking around San Francisco sometime, or Gloucester, Massachusetts, following a map that tells you take a left turn, straight uphill. Better still, try this in a wheelchair.
Toby Eglesfield, a graphic designer working in New Zealand, took this challenge seriously. After some aborted attempts with arrows, he settled on a trimetric projection (it’s like isometric, but slightly different), with different colored wedges to indicate the relative steepness of a street. Here’s the basic idea:
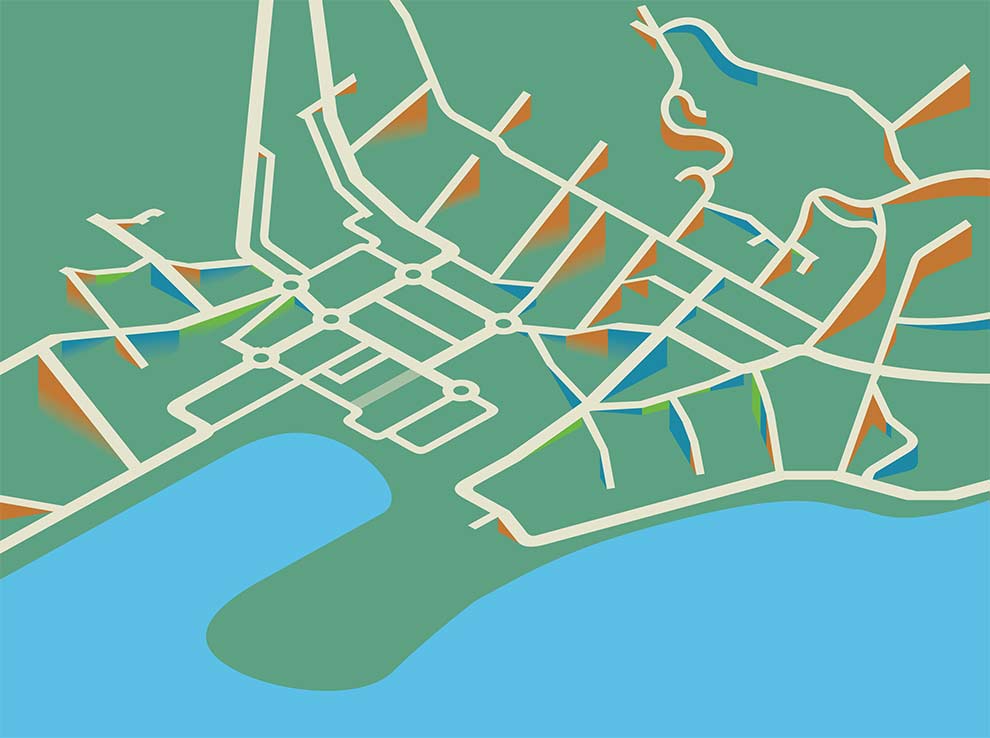
And here’s the completed product:
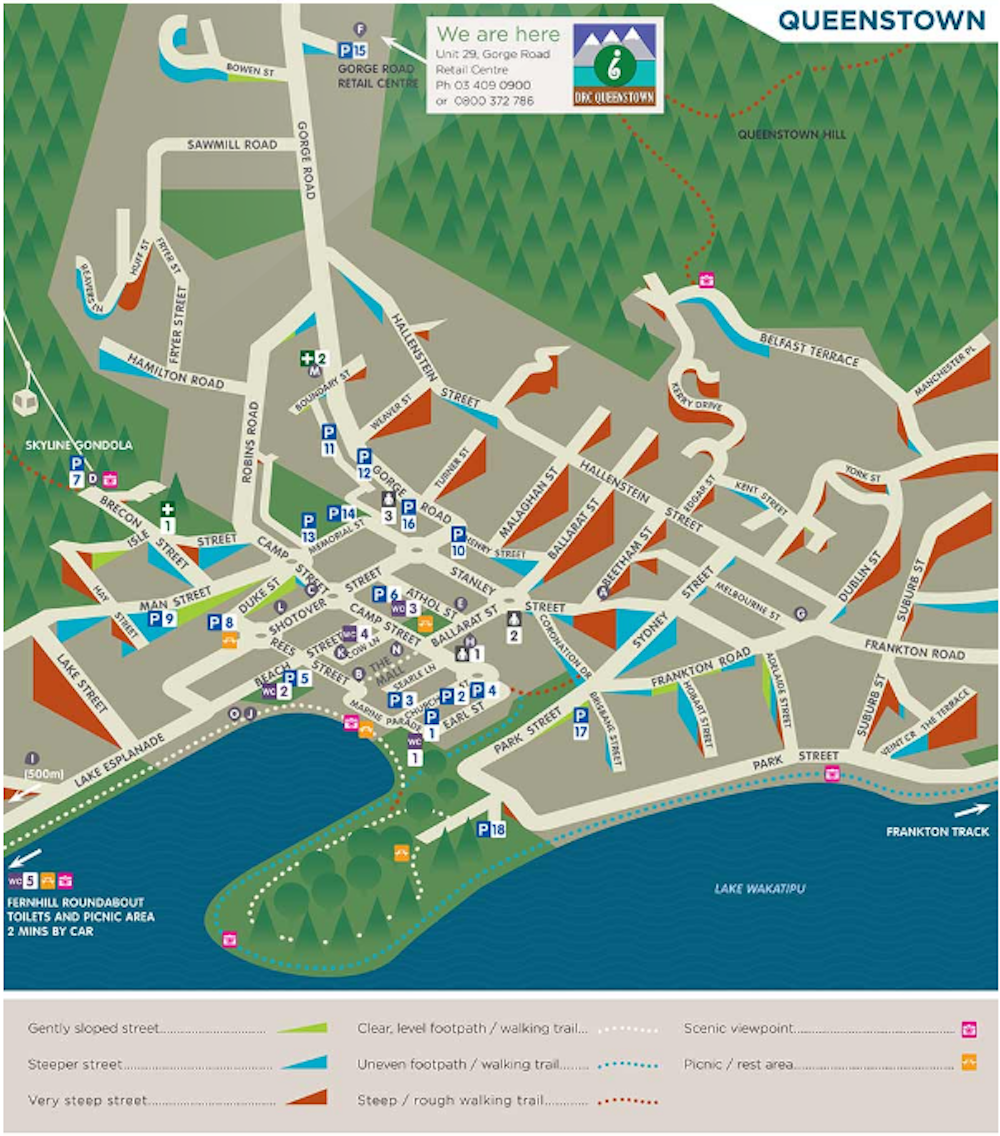
Created for the disAbilities Resource Centre in Queenstown, the map includes marks for accessible toilets, car parks, etc. I’d love to see a version for Manhattan, San Francisco — anywhere, really, but especially older cities with varied topography.

Socials & More