kottke.org posts about science
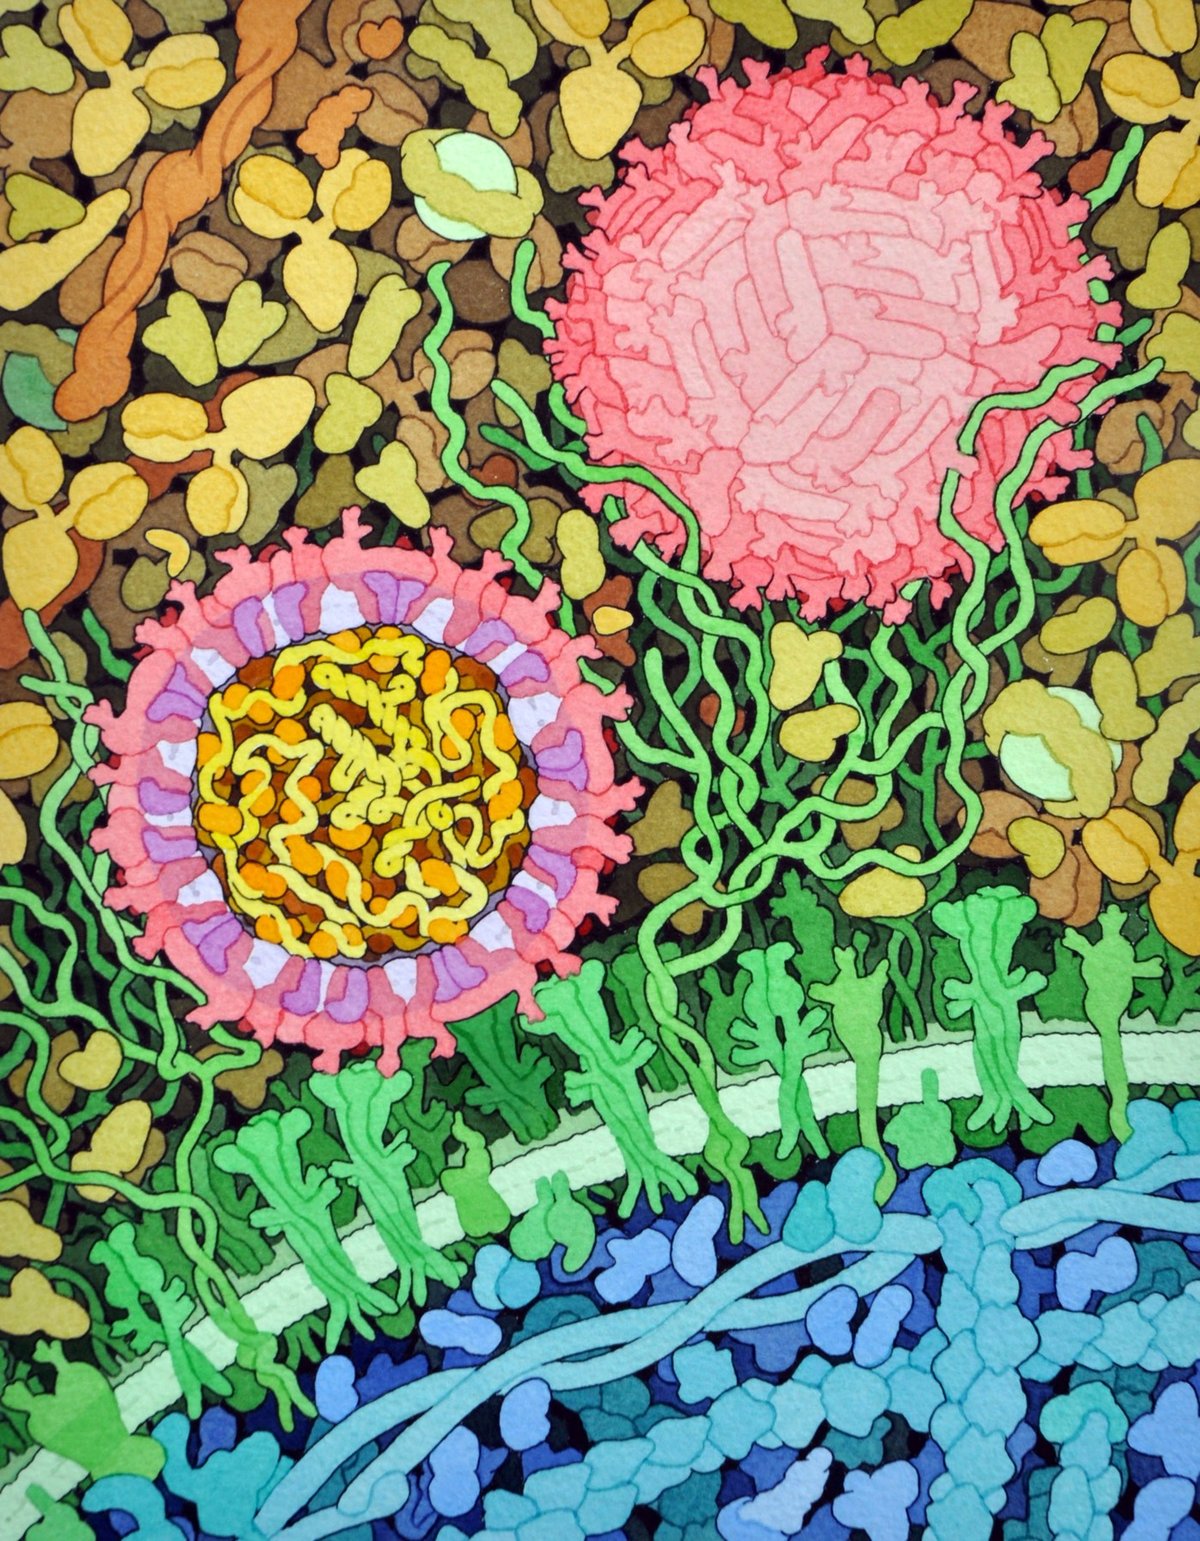
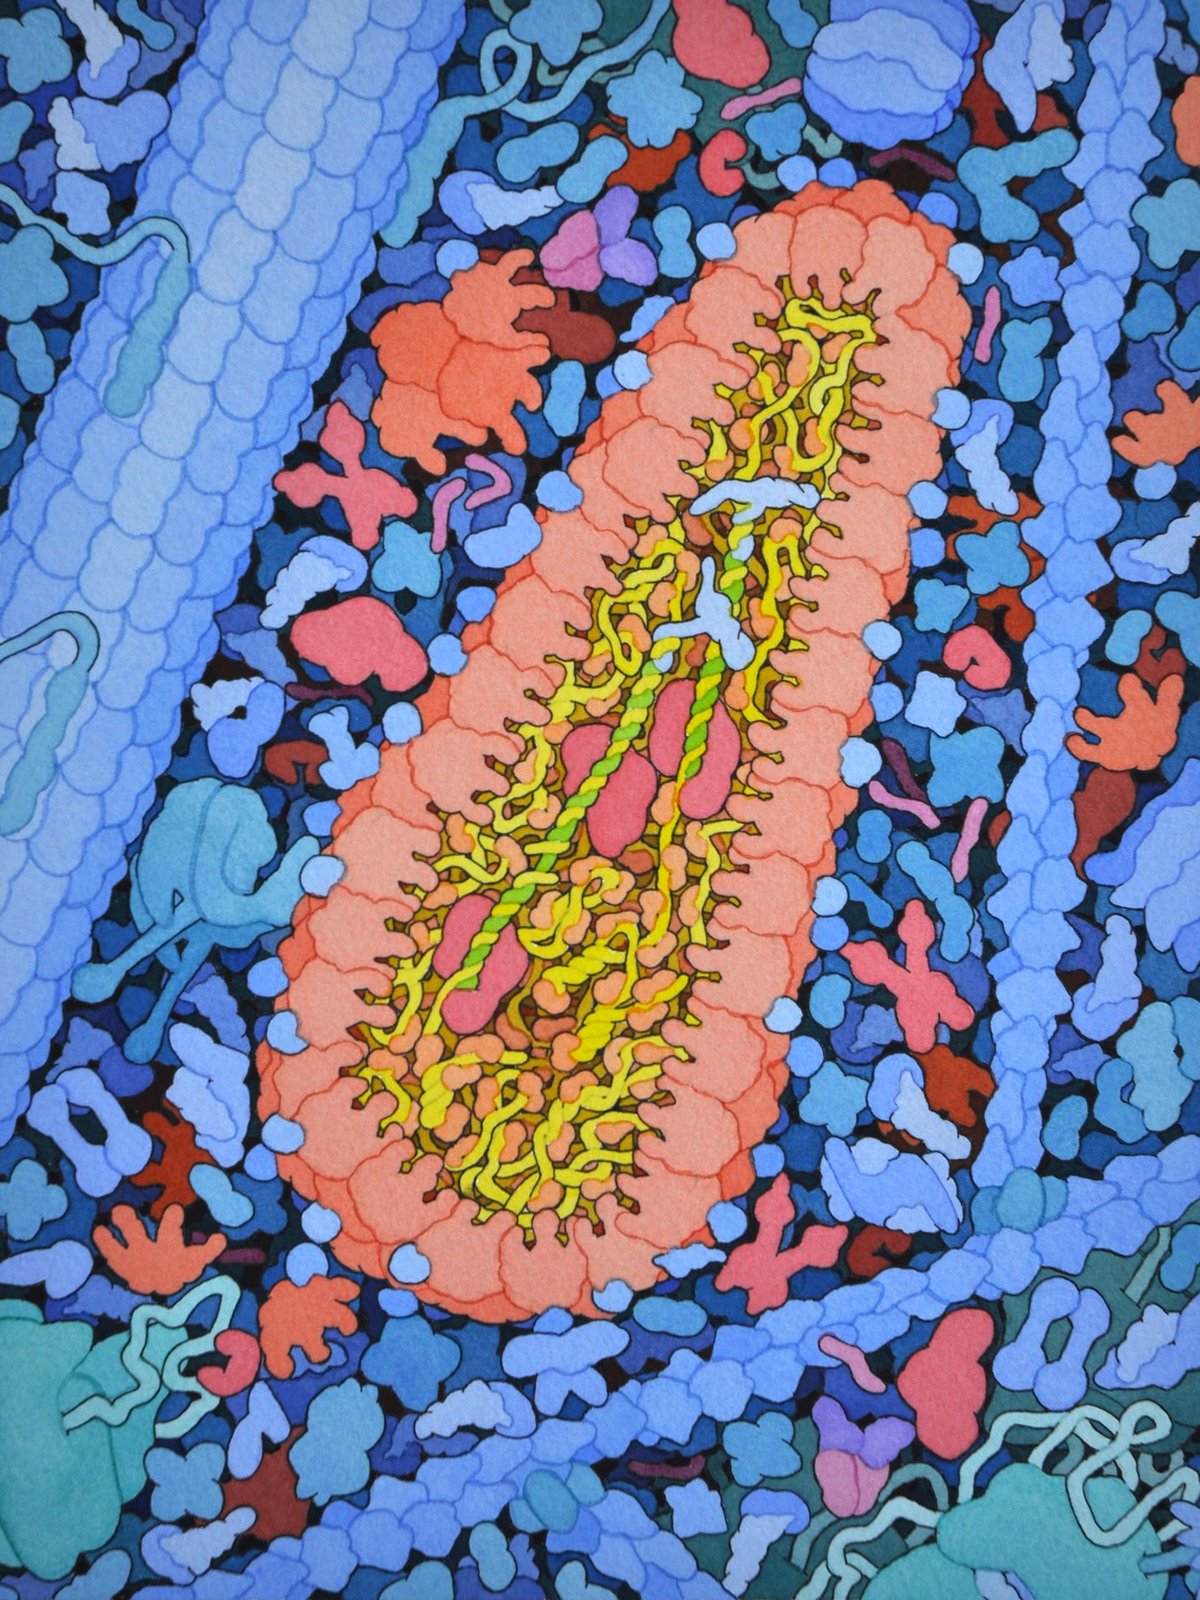
For more than 25 years, biologist David Goodsell has been making scientifically accurate paintings and illustrations of the molecular structures of things related to HIV, cancer cells, ebola, Zika, diabetes, proteins, enzymes, and hundreds of other scientific and medical processes.
Since the early 1990s, I have been working with a type of illustration that shows portions of living cells magnified so that you can see individual molecules. I try to make these illustrations as accurate as possible, using information from atomic structure analysis, electron microscopy, and biochemical analysis to get the proper number of molecules, in the proper place, and with the proper size and shape.
Much of his work is available to use for free (with attribution) and is scattered across the web: the Molecule of the Month, Molecular Landscapes, Illustrations for Public Use. He has also published several books of his paintings, the most popular of which is The Machinery of Life. Science magazine recently profiled Goodsell and his work.
In addition to studying pictures of cells from high-powered microscopes, Goodsell relies on molecular structures from electron microscopy (EM), x-ray crystallography, and nuclear magnetic resonance spectroscopy to make his paintings, which show the often crowded and complex world of cells and the microbes that infect them. He even uses the known weights of molecules if that’s all he has so that he can at least draw, say, a correctly sized circle. “I’m a scientist first,” he says. “I’m not making editorial images that are meant to sell magazines. I want to somehow inform the scientists and armchair scientists what the state of knowledge is now and hopefully give them an intuitive sense of how these things really look — or may look,” he says.
May look?
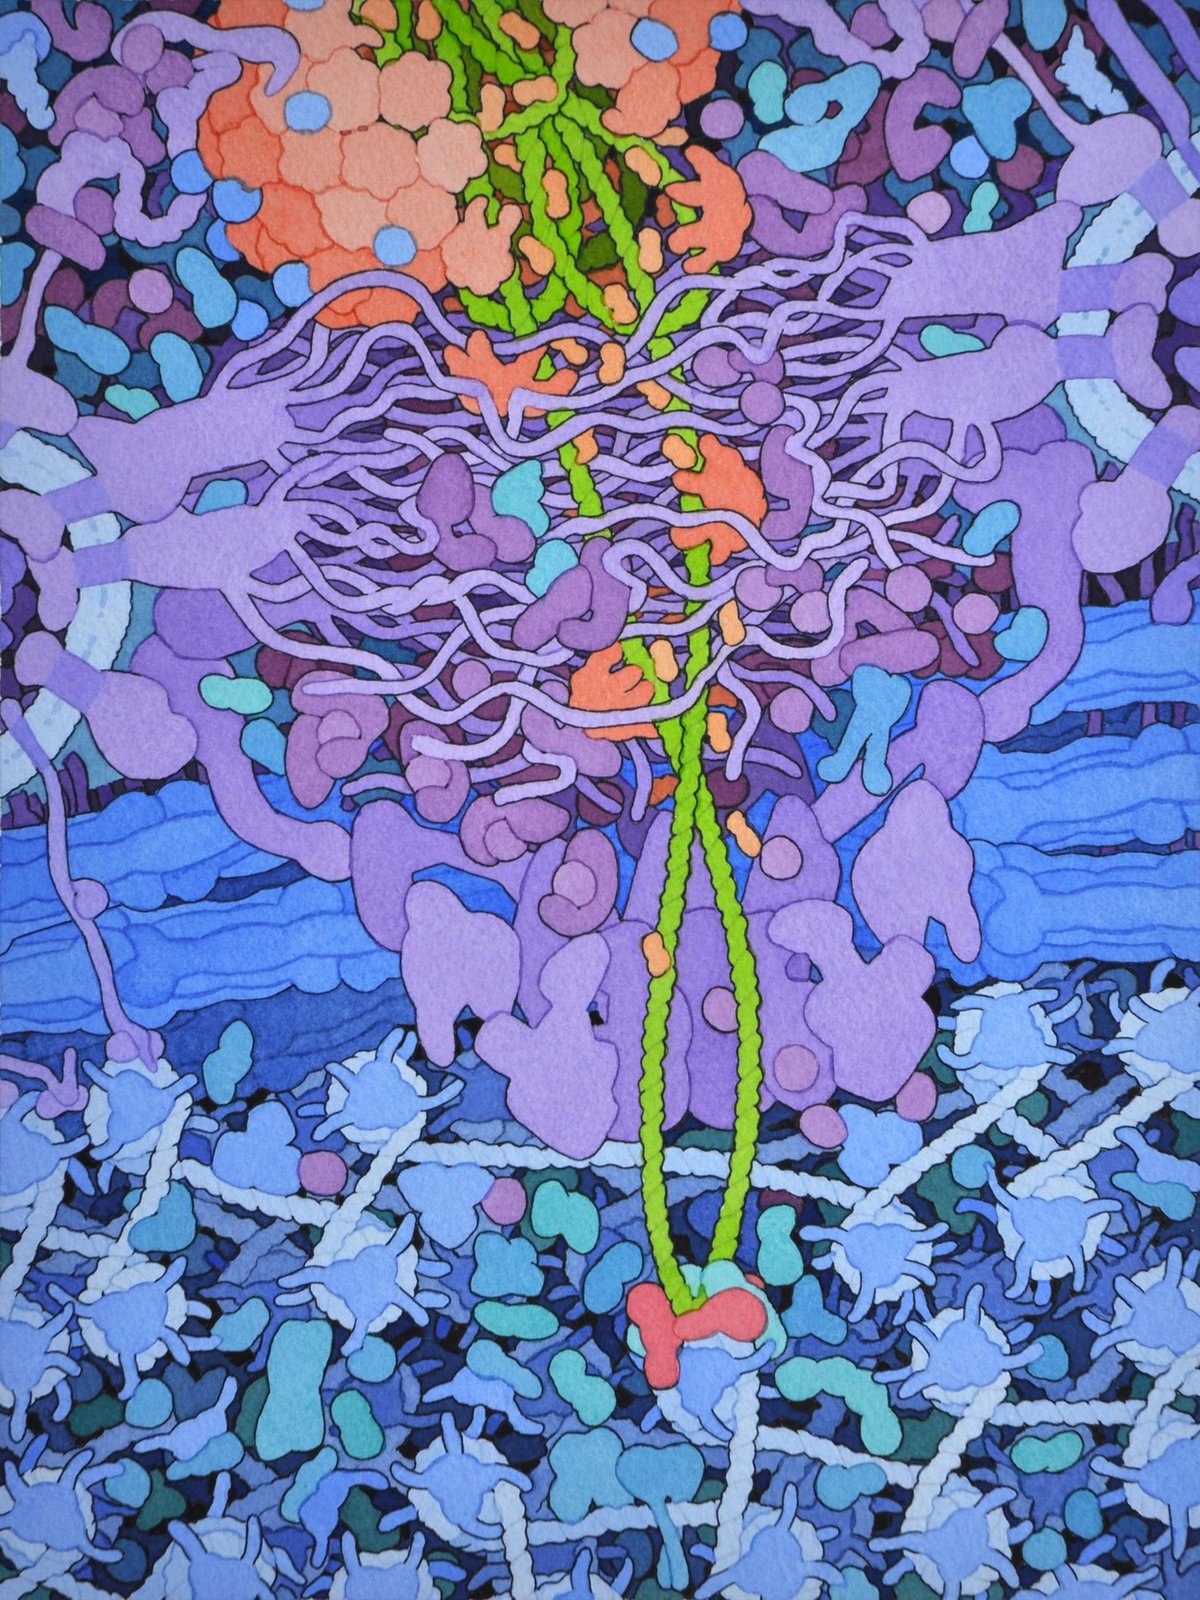
“These pictures have tons and tons and tons of artistic license,” he says. “They’re just one snapshot of something that’s intrinsically superdynamic. Every time I do a painting, the next day it’s out of date because there’s so much more data coming out.”
Here’s a quick video profile as well:
All images are by David S. Goodsell, the Scripps Research Institute. (via alexandra kammen)
The Nautilus expedition exploring the Davidson Seamount near Monterey Bay turned up something interesting last week: a relatively recent whale fall. A whale fall is when the body of a dead whale settles on the deep-sea floor, providing sustenance for the marine life in that area for decades.
While evidence of whale falls have been observed to remain on the seafloor for several years, this appears to be a relatively recent fall with baleen, blubber, and some internal organs remaining. The site also exhibits an interesting mid-stage of ecological succession, as both large scavengers like eel pouts are still stripping the skeleton of blubber, and bone-eating Osedax worms are starting to consume lipids (fats) from the bones. Other organisms seen onsite include crabs, grenadier, polychaetes, and deep-sea octopus.
The scientists were *so* excited to find this, a thriving mini ecosystem & food web in the process of formation at a depth of over 10,600 feet. They got pulled away from the carcass but went back for a closer look later.
You can read more about whale falls and their impact on deep-sea ecosystems in this New Yorker story from earlier this year.
For denizens of the seafloor, a whale fall is like a Las Vegas buffet — an improbable bounty in the middle of the desert. Rosebud had delivered about a thousand years’ worth of food in one fell swoop. The first animals to pounce had been scavengers, such as sleeper sharks and slimy, snake-like hagfish. In the course of about six months, they had eaten most of the skin and muscle. Inevitably, the scavengers had scattered pieces of flesh around the whale carcass, and native microbes had multiplied quickly around those scraps. Their feeding frenzy, in turn, had depleted oxygen in the seafloor’s top layers, creating niches for microbes that could make methane or breathe sulfate.
As Rosebud came into view, we saw colorful microbial carpets light up the screens-plush white, yellow, and orange mats, each a community of microbes precisely tuned to their chemical milieu. The whale’s towering rib cage had become a cathedral for worms, snails, and crabs, which grazed beneath its buttresses. A few hungry hagfish slithered through the skull’s eye sockets. When the cameras zoomed in, we saw that the bones were covered in red splotches. Rouse leapt from his chair and rushed to the monitors for a closer look: he suspected that the red tufts were colonies of remarkable bone-eating worms called Osedax, which had only just recently been described in a rigorous scientific study.
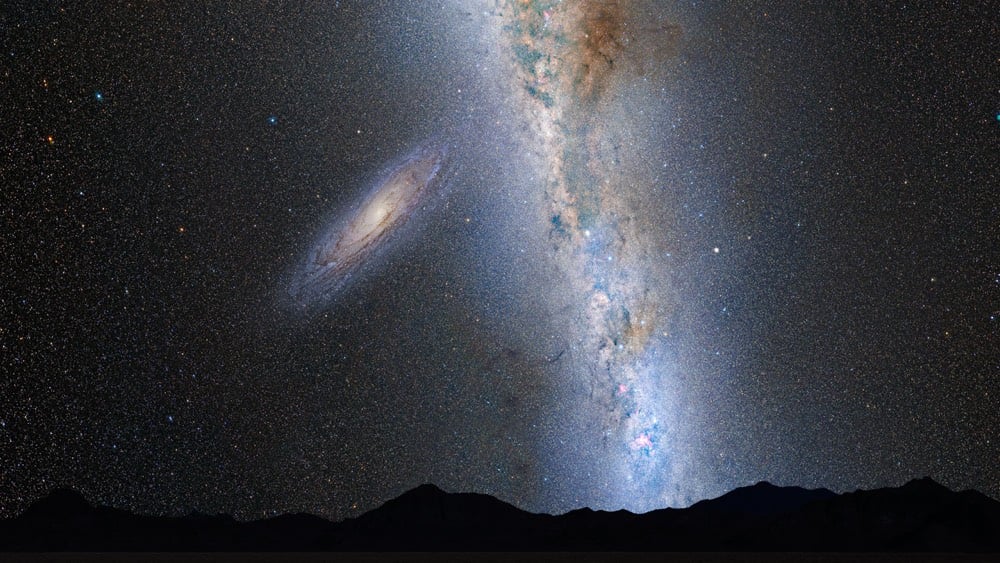
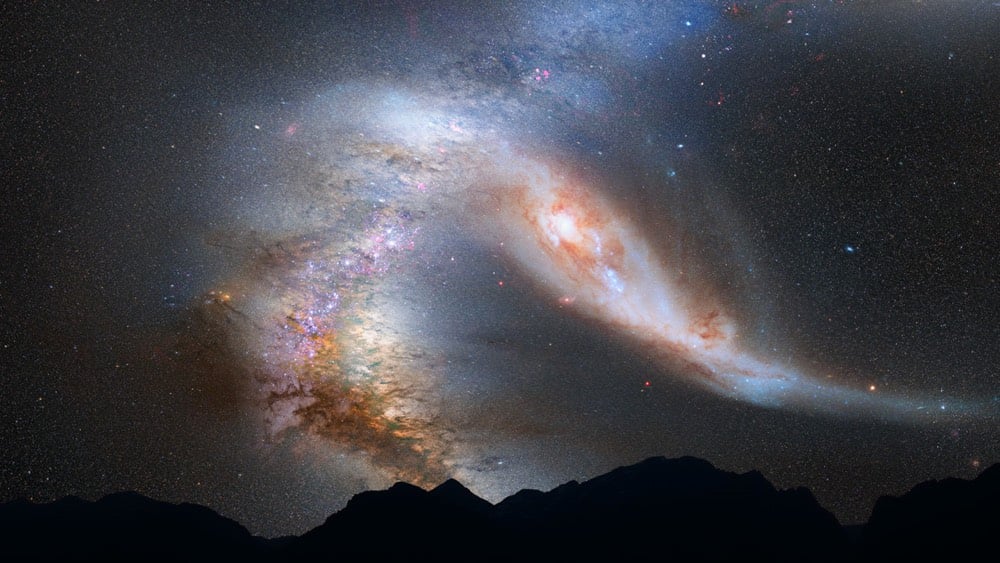
This is what our night sky is going to look like in 3.9 billion years:

Wow! So what’s going on here? Using data from the Hubble Space Telescope, astronomers at NASA have predicted that our own Milky Way galaxy and the nearby Andromeda galaxy (M31) will collide about 4 billion years from now. As part of the announcement from 2012, they produced a video of what the collision would look like and a series of illustrations of what our sky will look like during the collision process.1
In 2 billion years, Andromeda will be noticeably closer in the sky:
By 3.75 billion years, it will fill a significant chunk of the sky. And the Milky Way will begin to bend due to the pull of gravity from Andromeda:
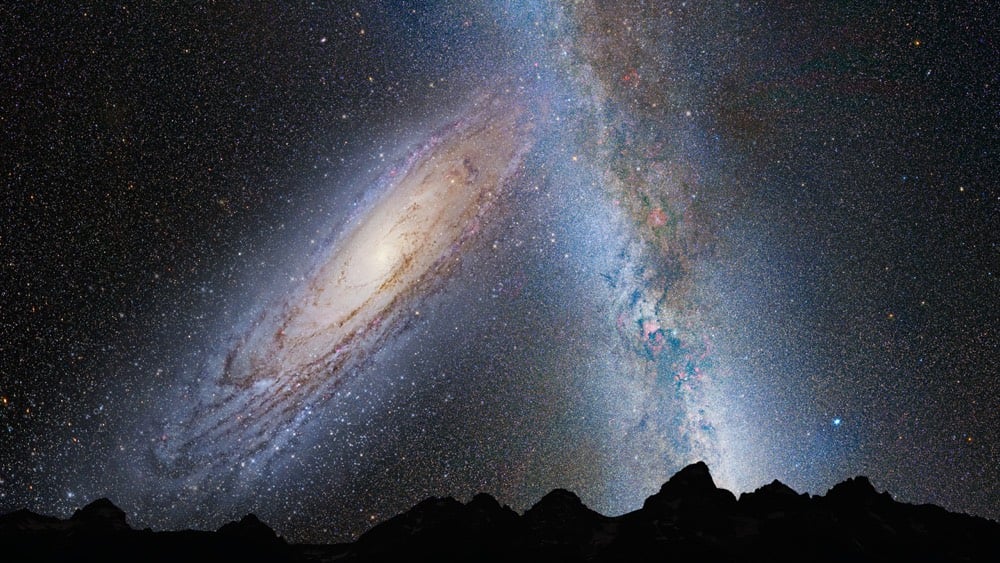
In about 3.85 billion years, the first close approach will trigger the formation of new stars, “which is evident in a plethora of emission nebulae and open young star clusters”:
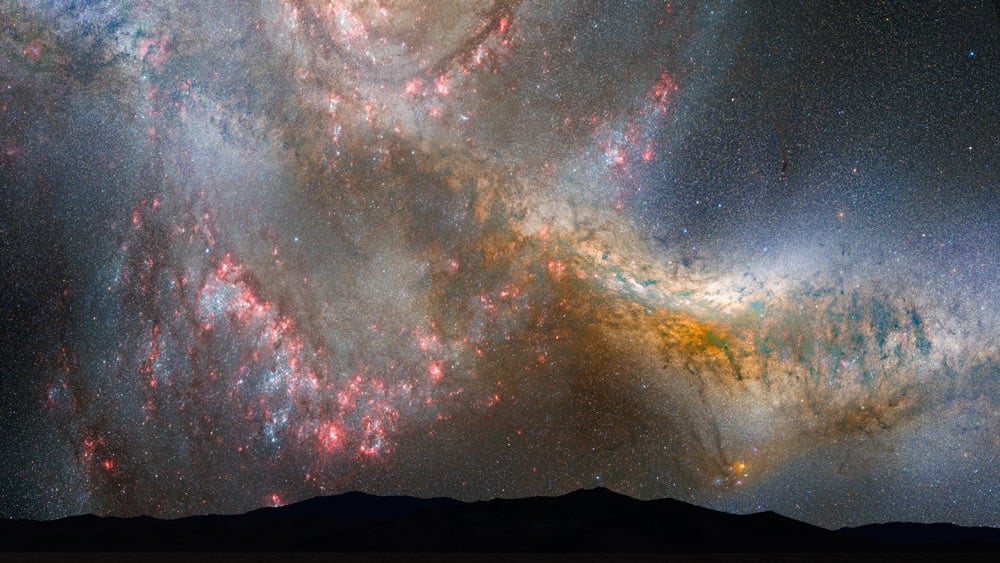
Star formation continues 3.9 billion years from now. Could you imagine actually going outside at night and seeing this? It’s like a nightly fireworks display:
After the galaxies pass by each other in 4 billion years, they are stretched and warped by gravity:
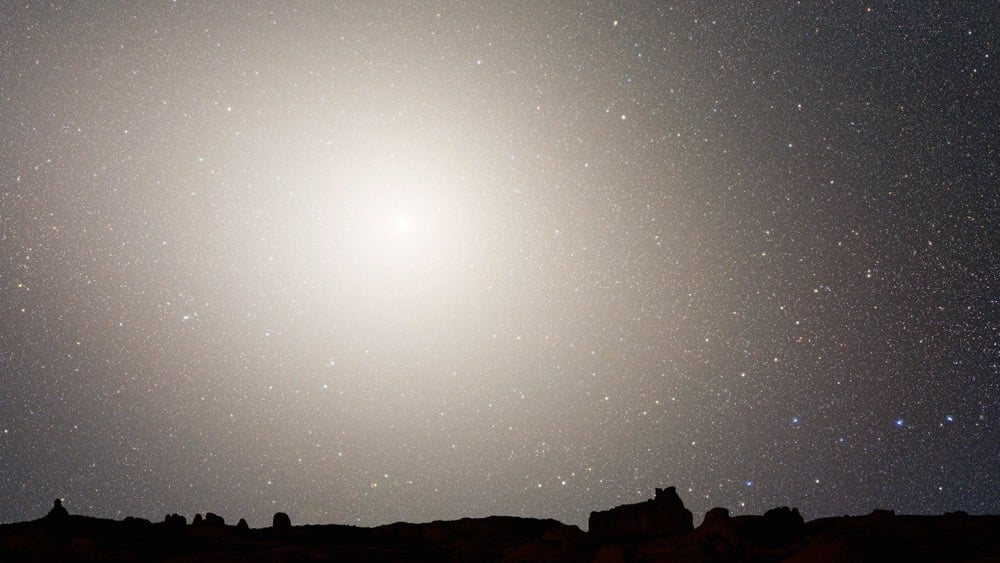
In 5.1 billion years, Andromeda and the Milky Way will come around for a second close pass, their galactic cores blazing bright in the night sky:

And finally, in 7 billion years, the two galaxies will have merged into a single elliptical galaxy nicknamed Milkdromeda:
Interestingly, despite the galactic collision and the dazzling view from Earth, it’s extremely unlikely that any individual stars will collide because of the sheer amount of empty space in galaxies.
This past weekend in Austria, Eliud Kipchoge ran the marathon distance of 26.2 miles in 1 hour, 59 minutes, and 40 seconds, the first person in recorded history to break the two-hour marathon barrier, a feat once thought impossible. Wanting to know a bit more about how Kipchoge did it, I watched a pair of videos. The first was from Mike Boyd (who you might have seen learning how to kickflip a skateboard in under 6 hours) and it’s very much from an interested fan’s perspective.
Wired has been following Kipchoge’s attempts at a faster marathon, particularly the technology angle, and in their video, they talk with the Mayo Clinic’s Dr. Michael Joyner, who predicted in a 1991 paper that a sub-2:00 marathon was possible.
Boyd’s video references this paper as well. From a piece that Joyner wrote about his paper:
During the 1980s, ideas emerged about how maximum oxygen consumption, lactate threshold and running economy interacted to determine distance running performance. During medical school around 1985, I started think about how a person could run if he/she had the best laboratory values ever recorded for all three variables. I came up with an estimated time a few seconds faster than 1:58!
So how did Kipchoge run so fast? Well, the answer has to do with another interesting thing about this whole thing: his effort did not set an official world record for the marathon. From The Atlantic, The Greatest, Fakest World Record:
The planning that went into the event was a fantasy of perfectionism. The organizers scouted out a six-mile circuit along the Danube River that was flat, straight, and close to sea level. Parts of the road were marked with the fastest possible route, and a car guided the runners by projecting its own disco-like laser in front of them to show the correct pace. The pacesetters, a murderers’ row of Olympians and other distance stars, ran seven-at-a-time in a wind-blocking formation devised by an expert of aerodynamics. (Imagine the Mighty Ducks’ “flying V,” but reversed.)
Kipchoge himself came equipped with an updated, still-unreleased version of Nike’s controversial Vaporfly shoes, which, research appears to confirm, lower marathoners’ times. He had unfettered access to his favorite carbohydrate-rich drink, courtesy of a cyclist who rode alongside the group. And the event’s start time was scheduled within an eight-day window to ensure the best possible weather.
In an official marathon attempt, you’re not allowed to have pacesetters rotating in and out, refreshment via bicycle, or a pace car lighting the way. They touch on this in the Wired video, but technology has been wrapped up in human athletic achievement for more than a century at least. Compared to a runner competing in 1960 — when the record was 2:15:16, set by Abebe Bikila in bare feet — runners today have the benefit of better training techniques, superior knowledge of human physiology, better shoes, corporate sponsorships & other assistance, lightweight clothes that wick away moisture and don’t chafe, specially designed diets, better in-race nutrition, and, let’s be honest here, performance-enhancing drugs.
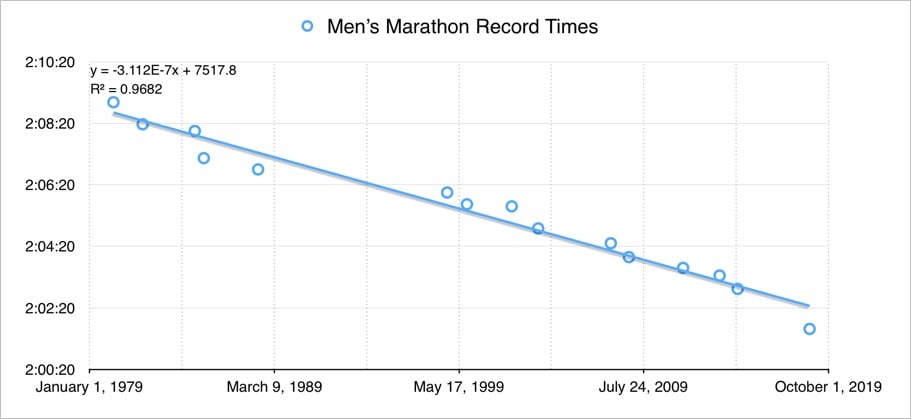
Drugs aside, all that is fine to use in an official marathon attempt, but racing alone with pacesetters (or downhill) is verboten. It’s always interesting where they draw the line on the use of technology in athletics. I think the most you can say at this point is that even with all these advantages, Kipchoge is perhaps the only person in the world right now who is capable of breaking the 2-hour barrier. But in two or three years? My guess is that 2 hours will be broken in an actual race in the next 5-7 years, even though a rough linear analysis I just did using men’s marathon record times since 1980 indicates that no one will run under 2 hours until 2033.
From the American Museum of Natural History in NYC, an animated timeline of human evolution, from when hominins first show up in the fossil record in Africa some seven million years ago to the appearance of Homo sapiens about 200,000 years ago. You can see artifacts and fossil remains of many of the hominins at the museum in the Hall of Human Origins. I haven’t been there in awhile…might be time for a visit.
I got this from Open Culture, where Colin Marshall goes into more detail:
And though hominins may have walked upright, they also climbed trees, but eventually lost the grasping feet needed to do so. Later they compensated with the very human-like development of making and using stone tools. Two million years ago, the well-known Homo erectus, with their large brains, long legs, and dextrous hands, made the famous migration out of Africa.
We know that by 1.2 million years thereafter Homo erectus’ brains had grown larger still, fueled by new cooking techniques. Only about 200,000 years ago do we, Homo sapiens, enter the picture, but not long after, we interbreed with the various hominin species already in existence as we spread outward to fill “every geographic niche” of the Earth.
The last bit of the video was unexpectedly sobering:
Homo sapiens were highly adaptable, quickly filling nearly every geographic niche. Other hominins went extinct. Climate pressures and competition with Homo sapiens may have wiped them out.
If we don’t change our ways soon, one way to look at the recent history of life on Earth is that modern humans came along 200,000 years ago and systematically conquered and killed the all of the animals on the planet larger than an ant. Not such a great deal for anything but people.
Ten years ago, in the midst of the 2009 swine flu pandemic, I wrote about the manufacturing process for the H1N1 flu vaccine. It involves billions of chicken eggs.
The most striking feature of the H1N1 flu vaccine manufacturing process is the 1,200,000,000 chicken eggs required to make the 3 billion doses of vaccine that may be required worldwide. There are entire chicken farms in the US and around the world dedicated to producing eggs for the purpose of incubating influenza viruses for use in vaccines. No wonder it takes six months from start to finish.
The post holds up pretty well because, according to the CDC, this is still the way most flu vaccines in America are manufactured. Here’s a look at pharmaceutical company GSK’s egg-based process:
Two other techniques for making flu vaccines were approved for use in the US in 2012 and 2013 respectively, cell-based flu vaccines:
‘Cell-based’ refers to how the flu vaccine is made. Most inactivated influenza vaccines are produced by growing influenza viruses in eggs. The influenza viruses used in the cell-based vaccine are grown in cultured cells of mammalian origin instead of in hens’ eggs.
A cell-based flu vaccine was developed as an alternative to the egg-based manufacturing process. Cell culture technology is potentially more flexible than the traditional technology, which relies upon adequate supply of eggs. In addition, the cell-based flu vaccine that uses cell-based candidate vaccine viruses (CVVs) has the potential to offer better protection than traditional, egg-based flu vaccines as a result of being more similar to flu viruses in circulation.
And recombinant flu vaccines:
NIAID and its industry partners have made progress in moving from both the egg-based and cell-based flu vaccine production methods toward recombinant DNA manufacturing for flu vaccines. This method does not require an egg-grown vaccine virus and does not use chicken eggs at all in the production process. Instead, manufacturers isolate a certain protein from a naturally occurring (“wild type”) recommended flu vaccine virus. These proteins are then combined with portions of another virus that grows well in insect cells. The resulting “recombinant” vaccine virus is then mixed with insect cells and allowed to replicate. The flu surface protein called hemagglutinin is then harvested from these cells and purified.
Both of these new techniques make production quicker, thereby resulting in more effective vaccines because they are more likely to match the strains of whatever’s “going around”.
As a reminder, you should get a flu shot every year in the fall. The CDC recommends that “everyone 6 months of age and older should get a flu vaccine every season with rare exception”, especially those “who are at high risk of serious complications from influenza”. Flu vaccines are covered by your health insurance without copay (thanks, Obama!) and are often available at drug stores without an appointment or a long wait. So go get one!
Ze Frank released the most recent video in his True Facts series about animals last month. Meet the ogre-faced spider. Admittedly I haven’t watched any of the other True Facts videos in awhile, but this one seemed unusually informative (while retaining Frank’s signature humorous asides). I would watch an entire nature series like this: funny but not dumbed down on the science side.
With the launch of Sputnik in 1957, the Soviet Union kicked off the Space Race and for the first several years (arguable up until the Moon landing in ‘69), they dominated the United States. One of their “firsts” in the early years was taking the first photo of the far side of the Moon 60 years ago this month.
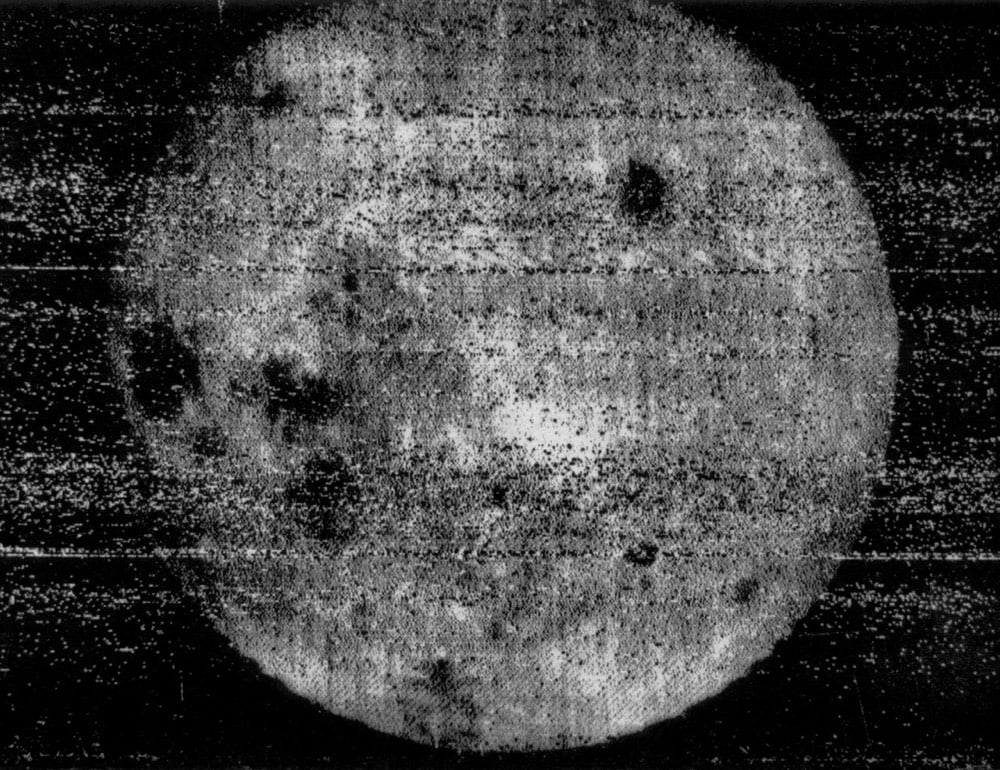
Astronomer Kevin Hainline wrote a fascinating account of how the Soviet’s Luna 3 spacecraft took the photo and then transmitted it back to Earth.
First off, Luna 3, the first three-axis stabilized spacecraft, had to reach the Moon to take the pictures, and it had to use a little photocell to orient towards the Moon so that now, while stabilized, it could take the pictures. Which it did. On PHOTOGRAPHIC FILM.
And it gets WILDER because these photos were then moved to a little CHEMICAL PLANT to DEVELOP AND DRY THEM. That’s right, Luna 3 had a little 1 Hour Photo inside. Now you’re thinking, well, how do you get those actual photos back to the Earth?
How indeed? The spacecraft faxed the photos to Earth. A few years later, when the Soviets’ Luna 9 took the first photo on the Moon’s surface and went to transmit it back to Earth, a group in the UK was able to read the signal with a fax machine and the resulting image was published the next day on the front page of the Daily Express.
In 2008, Japanese creative agency Hakuhodo created a campaign for the World Wildlife Federation that featured photos of endangered animals where the number of pixels in the photo matched the remaining population of the animal pictured.
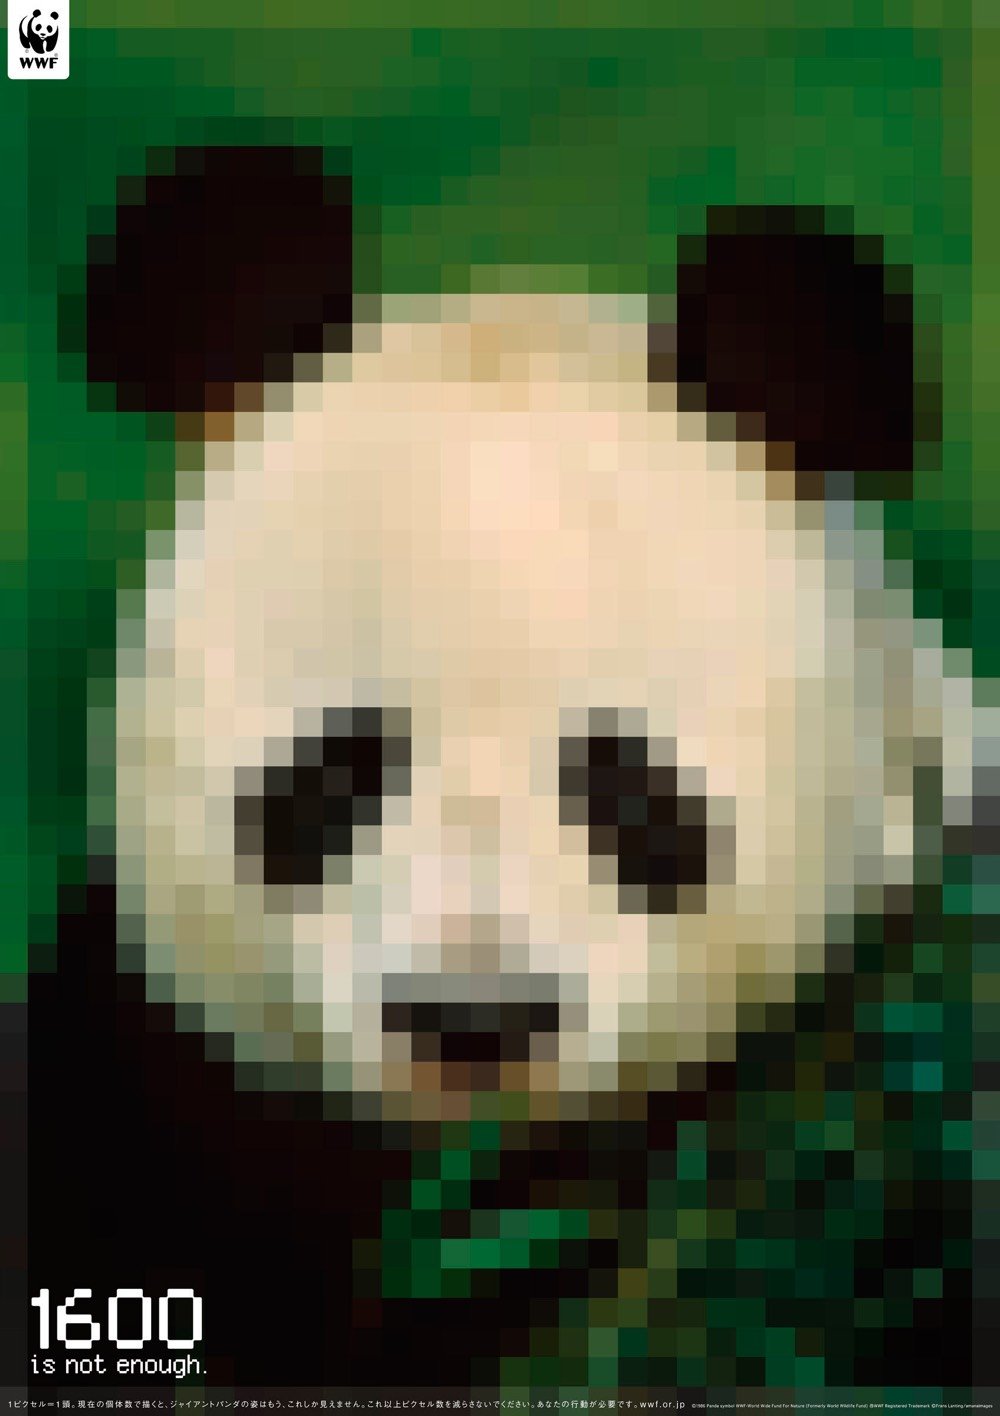

Imgur user JJSmooth44 recently updated the campaign to include many more animals, including the unrecognizable Javan rhino.
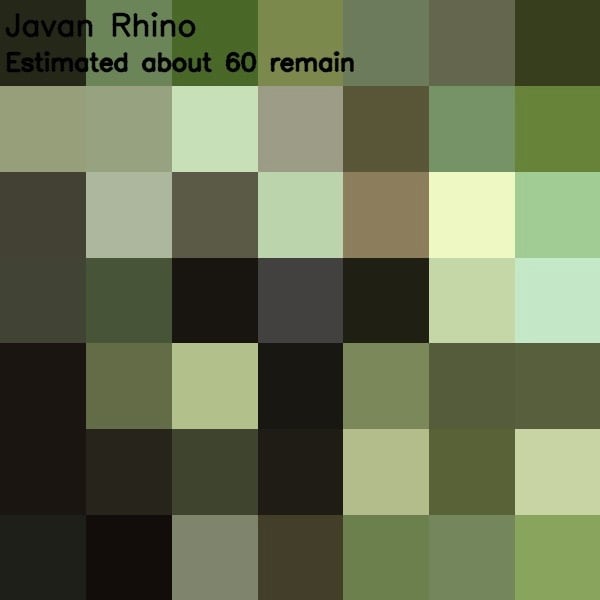
(via @UnlikelyWorlds)
Since the 1990s, Pulitzer prizewinning novelist Cormac McCarthy has been a fixture at the Santa Fe Institute, a transdisciplinary research institute in New Mexico. During that time, he’s helped edit scientific papers for many faculty and postdocs. A pair of biologists, Van Savage & Pamela Yeh, recently condensed McCarthy’s scientific writing advice into an article for Nature.
Use minimalism to achieve clarity. While you are writing, ask yourself: is it possible to preserve my original message without that punctuation mark, that word, that sentence, that paragraph or that section? Remove extra words or commas whenever you can.
Inject questions and less-formal language to break up tone and maintain a friendly feeling. Colloquial expressions can be good for this, but they shouldn’t be too narrowly tied to a region. Similarly, use a personal tone because it can help to engage a reader. Impersonal, passive text doesn’t fool anyone into thinking you’re being objective: “Earth is the centre of this Solar System” isn’t any more objective or factual than “We are at the centre of our Solar System.”
Finally, try to write the best version of your paper: the one that you like. You can’t please an anonymous reader, but you should be able to please yourself. Your paper — you hope — is for posterity. Remember how you first read the papers that inspired you while you enjoy the process of writing your own.
Most of this is good advice for the writing in general.
Curious about the social behaviors of cephalopods, marine biologist David Scheel brought an octopus named Heidi home to live with him and his teenaged daughter. In this clip from an upcoming PBS show called Octopus: Making Contact, you can see the octopus changing colors while colors while she sleeps, which Scheel speculates is due to actions happening in the octopus’s dream.
If she is dreaming, this is a dramatic moment. You can almost just narrate the body changes and narrate the dream. So here she’s asleep and she sees a crab and her color starts to change a little bit. Then she turns all dark; octopuses will do that when they leave the bottom. This is a camouflage, like she’s just subdued a crab and now she’s going to sit there and eat it, and she doesn’t want anyone to notice her.
This program already aired in the UK with the much snappier title of The Octopus in My House; check out a review here.
Heidi loves to play. Given a toy (an old pill bottle, say), she hurls it round as if it were a swimming aid, and she a toddler newly out of water wings. Scheel has trained her so effectively to pull on a string that activates a buzzer that in the end he has to dismantle the thing if he wants to get a night’s sleep. She loves to touch and be touched, entwining her arms with those of Laurel for minutes at a time. Does she recognise her owners? Indubitably. When Scheel approaches the tank as himself, she rushes to its side, as if in greeting. But when he approaches disguised in a rubber mask, she hides.
(thx, dunstan)
Bloomberg Businessweek dedicated their entire Sept 2, 2019 issue to the periodic table (it’s 150 years old this year) and the elements it contains. From the introductory essay:
Over the past century and a half, but particularly since World War II, scientists and engineers have learned to treat the periodic table like a banquet table-a bountiful spread from which to pluck what they need. There’s scandium in bicycle frames, tin (stannous fluoride) in toothpaste, tungsten in catheters, and arsenic in some computer chips. We are well past the Stone Age, the Bronze Age, and the Iron Age, and into the Everything Age, because almost every entry on the periodic table is being put to some kind of use in today’s economy (excluding synthetic elements that are costly to make and highly radioactive, such as einsteinium).
Cellphones exemplify the complexification. The first ones in the 1980s “were the size of a shoebox and consisted of 25 to 30 elements,” Larry Meinert, U.S. Geological Survey deputy associate director for energy and minerals, said in 2017. “Today, they fit in your pocket or on your wrist and are made from about 75 different elements, almost three-quarters of the periodic table.” That may include tantalum from Rwanda, potassium from Belarus, silver from Mexico, tin from Myanmar, carbon from India, and germanium from China.
Scrolling down on the main story page will take you on a modern-day tour of the periodic table from the lightest elements (hydrogen, helium, lithium) to the heavier ones (uranium, polonium) to some fake ones (adamantium, unobtanium, feminum).
Twenty-five years ago, physicist Cesare Marchetti argued that people, on average, tend to keep their commutes to about an hour a day, round-trip. For Citylab, Jonathan English looks at how this inclination has interacted with advances in transportation to affect how cities grow and evolve. For instance, walking and travel by horse kept cities to an effective diameter of a few miles, allowing their density to grow over many centuries.
Sure enough, most cities from the ancients to the Industrial Revolution did not grow much bigger than a two-mile diameter. Their core areas were often even smaller, though some of the poor lived in settlements outside the city gates. Ancient Rome packed as many as a million people into an area a little more than two miles in diameter. Medieval Paris stretched about two miles from the Bastille to the Louvre, Vienna’s Innere Stadt measures only one mile in diameter, and the historic City of London is nicknamed the “Square Mile” for a reason. Beijing’s walls enclosed an inner city about three miles in diameter; into the 20th century, that still made up most of the developed area.
Rail, streetcars, bicycles, subways, and cars followed, each increasing the amount of distance from a city’s center that could be reached within Marchetti’s time limit.
The car on the expressway enabled large numbers of people to travel long distances on a day-to-day basis. Instead of small railroad suburbs, where housing was restricted to a short radius around stations, drivers spread out across suburbs could now commute 20 miles in 30 minutes. If the streetcar city covered 50 square miles, the 40-mile-diameter expressway city could cover over 1,250 square miles.*
Randall Munroe’s new book, How To: Absurd Scientific Advice for Common Real-World Problems, just came out and Wired has a lengthy excerpt: How to Mail a Package (From Space).
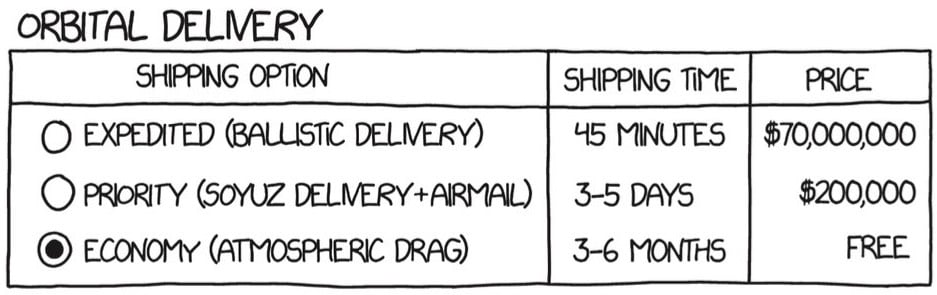
Getting an object down to Earth from the International Space Station is easy: you can just toss it out the door and wait. Eventually, it will fall to Earth.
There’s a very small amount of atmosphere at the ISS’s altitude. It’s not much, but it’s enough to produce a tiny but measurable amount of drag. This drag sooner or later causes objects to slow down, fall into a lower and lower orbit, and eventually hit the atmosphere and (usually) burn up. The ISS also feels this drag; it uses thrusters to compensate, periodically boosting itself up into a higher orbit to make up for lost altitude. If it didn’t, its orbit would gradually decay until it fell back to Earth.
This shipping method has two big problems: First, your package will burn up in the atmosphere before it ever reaches the ground. And second, if it does survive, you’ll have no way to know where it will land. To deliver your package, you’ll have to solve both these problems.
Fun fact: a piece of paper drifting down from orbit might move slowly enough not to burn up on reentry.
An endling is the last known member of a species and once it dies, the species becomes extinct. George was a tree snail that died in early 2019, the last member of the now-extinct Achatinella apexfulva species. He was 14.
Few people would mourn a snail, but Sischo and his team had spent years caring for George. He was a daily constant, a familiar friend. He was also the last known snail of his kind, the final Achatinella apexfulva. It is said that everyone dies alone, but that was doubly true for George-alone at the end both in his cage and in the world.
When the last of a species disappears, it usually does so unnoticed, somewhere in the wild. Only later, when repeated searches come up empty, will researchers reluctantly acknowledge that the species must be extinct. But in rare cases like George’s, when people are caring for an animal’s last known representative, extinction-an often abstract concept-becomes painfully concrete. It happens on their watch, in real time. It leaves behind a body. When Sischo rang in the new year, Achatinella apexfulva existed. A day later, it did not. “It is happening right in front of our eyes,” he said.
There’s a part early on in the video where Sischo is showing the snails in his team’s care and he casually points to a small chamber and says “here is the entire world’s population of this snail species” — I found that incredibly sad and had to stop the video for awhile to regroup. (Oh and the cardboard boxes labeled “snail morgue”.)
George was unique and we’re trying to avoid another George. But we have 100 species that will be gone within the next 5 to 10 years without intervention.
SpaceX took its Starhopper rocket out for a little test run in Texas the other day, taking off and then landing about 300 feet away after reaching a height of about 500 feet. Spacehopper is a prototype of the company’s Starship spacecraft & rocket, which they plan to fly to and land on the Moon and Mars.
I’ve written about the wonder of SpaceX’s reusable rockets before, but the Starhopper test in particular seems like some deeply sci-fi shit, like what society imagined future space travel would look like. The ship looks and moves like something straight out of a late 60s Dr. Who serial.
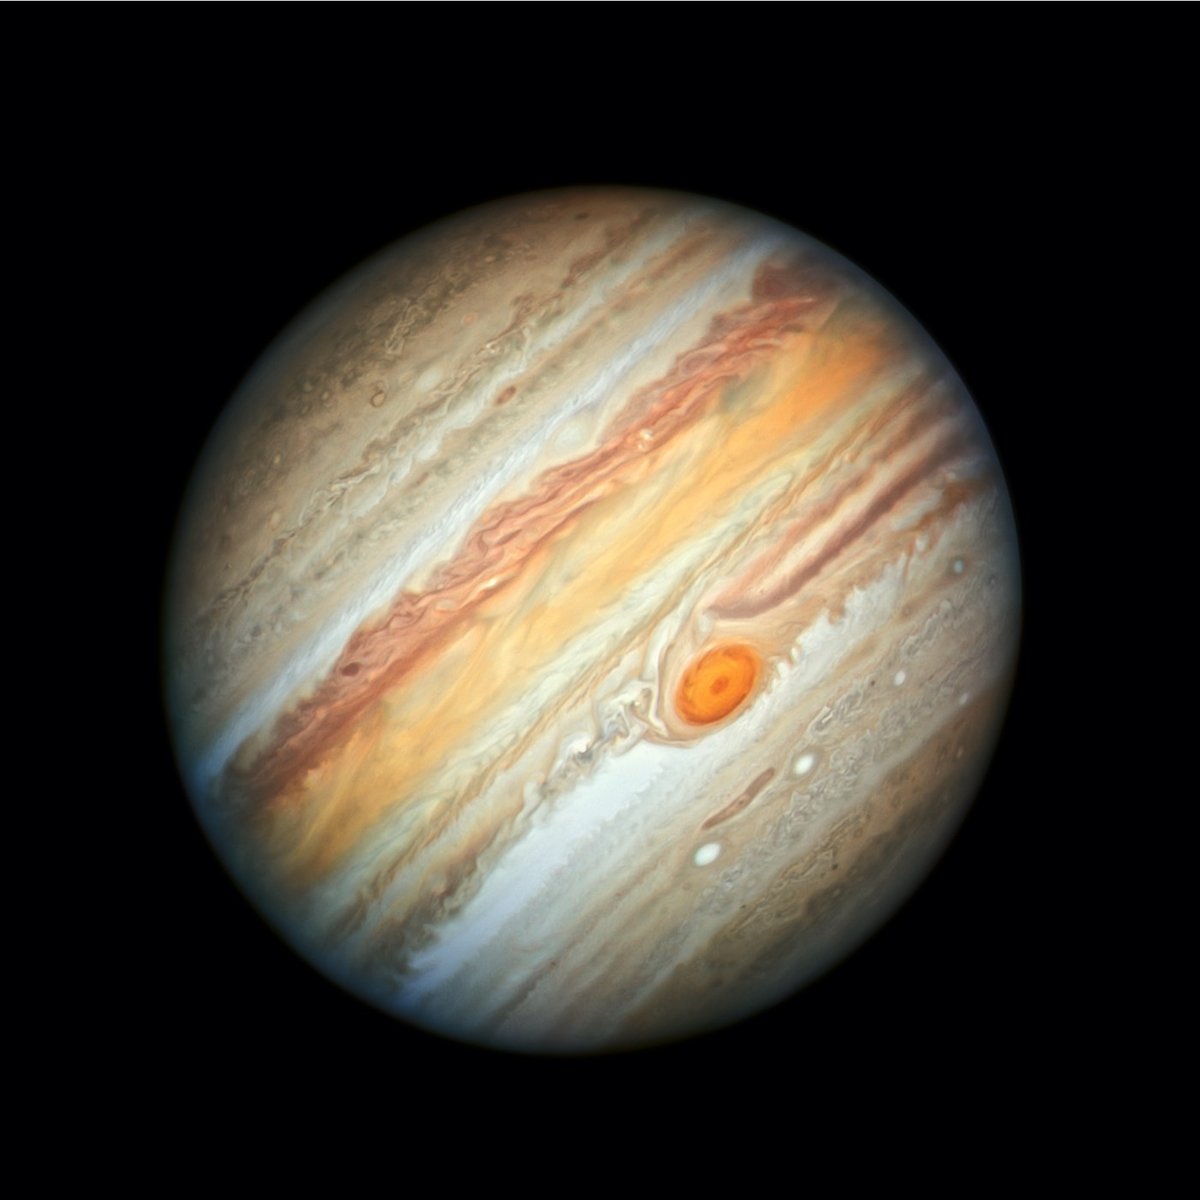
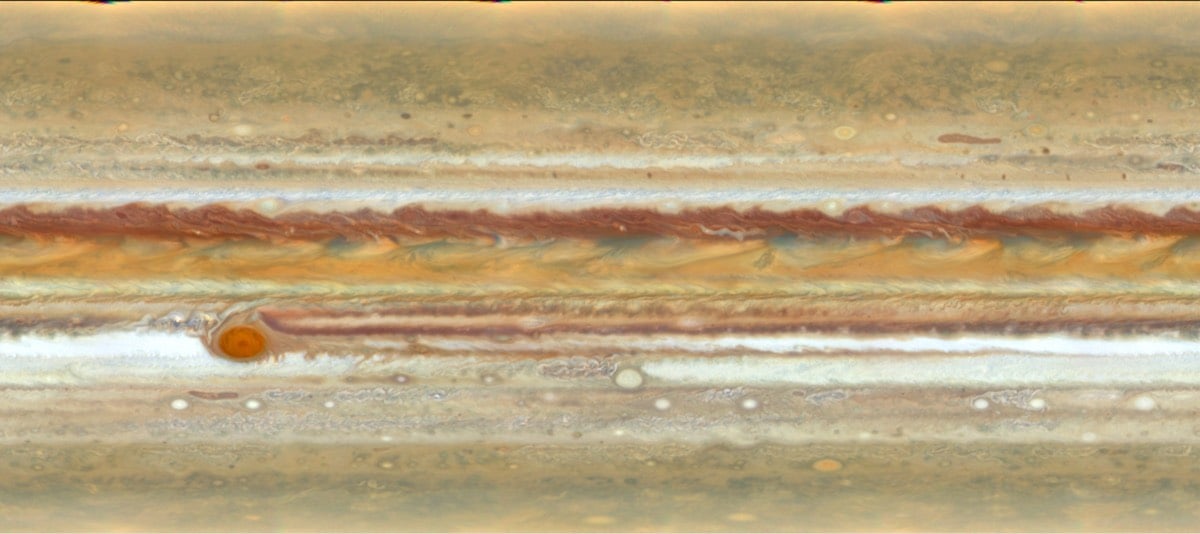
A photo of Jupiter taken by the Hubble Space Telescope in late June was recently released by NASA. Among other things, it shows just how much smaller, redder, and rounder the Great Red Spot has gotten.
The Great Red Spot is a towering structure shaped like a wedding cake, whose upper haze layer extends more than 3 miles (5 kilometers) higher than clouds in other areas. The gigantic structure, with a diameter slightly larger than Earth’s, is a high-pressure wind system called an anticyclone that has been slowly downsizing since the 1800s. The reason for this change in size is still unknown.
The spot was “once big enough to swallow three Earths with room to spare” but has been shrinking steadily since a brief expansion in the 1920s. As the storm contracts, it has stretched up into the Jovian atmosphere.
Because the storm has been contracting, the researchers expected to find the already-powerful internal winds becoming even stronger, like an ice skater who spins faster as she pulls in her arms.
Instead of spinning faster, the storm appears to be forced to stretch up. It’s almost like clay being shaped on a potter’s wheel. As the wheel spins, an artist can transform a short, round lump into a tall, thin vase by pushing inward with his hands. The smaller he makes the base, the taller the vessel will grow.
Recently amateur astronomers have observed “flakes” or “blades” coming off of the storm and dissipating into the larger atmosphere, a formerly rare phenomenon that now seems more common.
The Hubble photographs also yielded a rotating view of the planet as well as a very cool stretched-out photo of the surface:
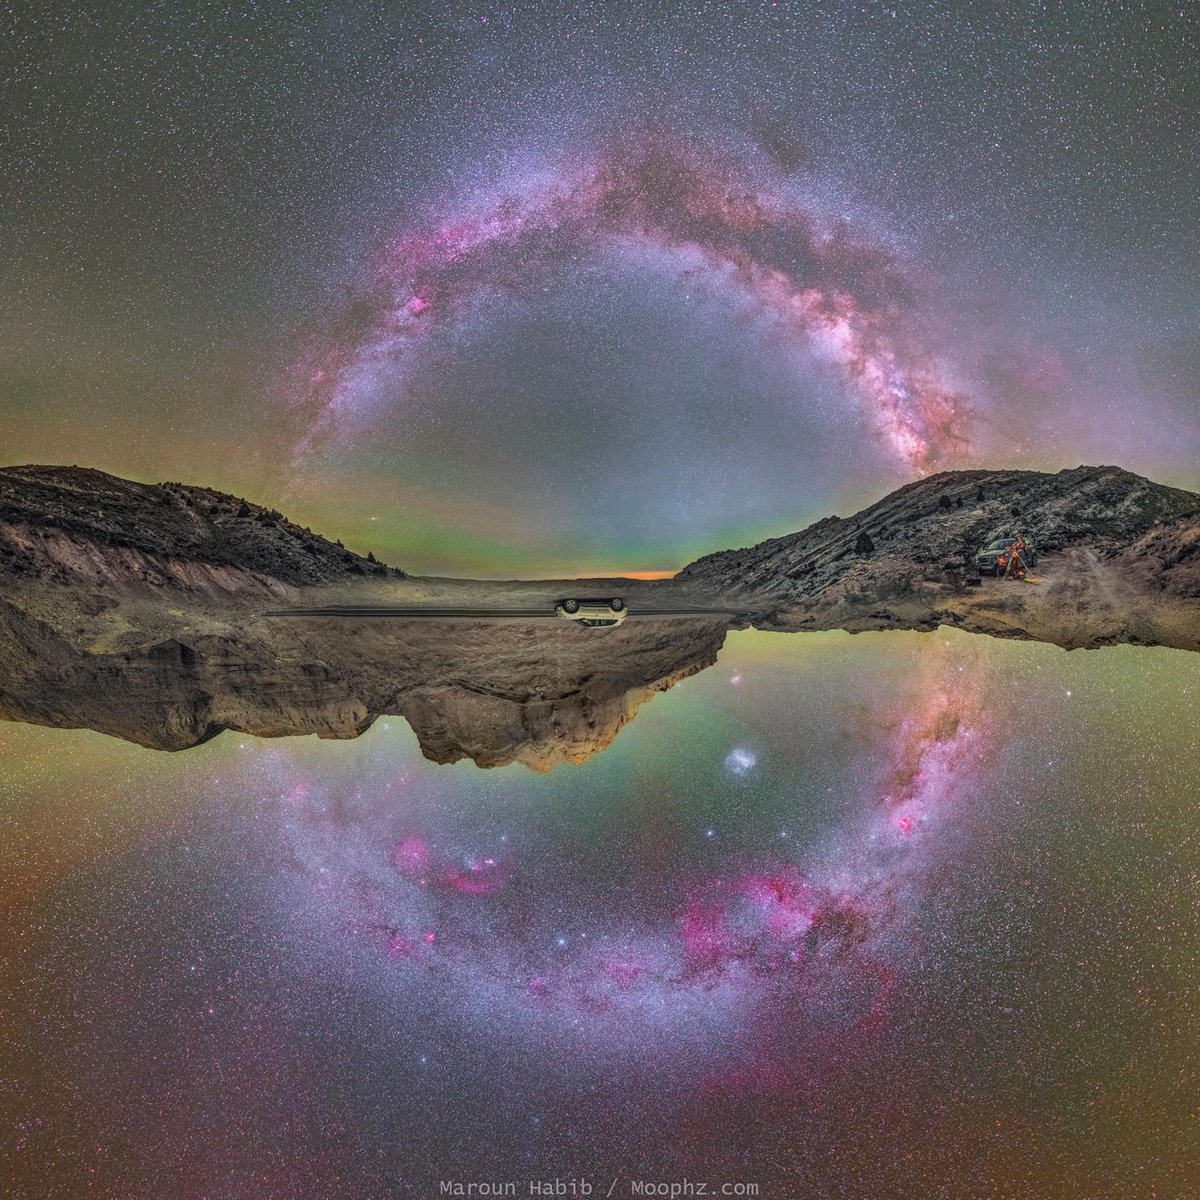
By photographing two separate nighttime scenes, one in the northern hemisphere and the other in the southern hemisphere, amateur astrophotographer Maroun Habib cleverly produced this dazzling image of the complete galactic plane visible from Earth.
Is it possible to capture the entire plane of our galaxy in a single image? Yes, but not in one exposure — and it took some planning to do it in two. The top part of the featured image is the night sky above Lebanon, north of the equator, taken in 2017 June. The image was taken at a time when the central band of the Milky Way Galaxy passed directly overhead. The bottom half was similarly captured six months later in latitude-opposite Chile, south of Earth’s equator. Each image therefore captured the night sky in exactly the opposite direction of the other, when fully half the Galactic plane was visible.
See also The Earth Rotating Beneath a Stationary Milky Way, which went viral after I posted it two weeks ago. (via @surfinsev)
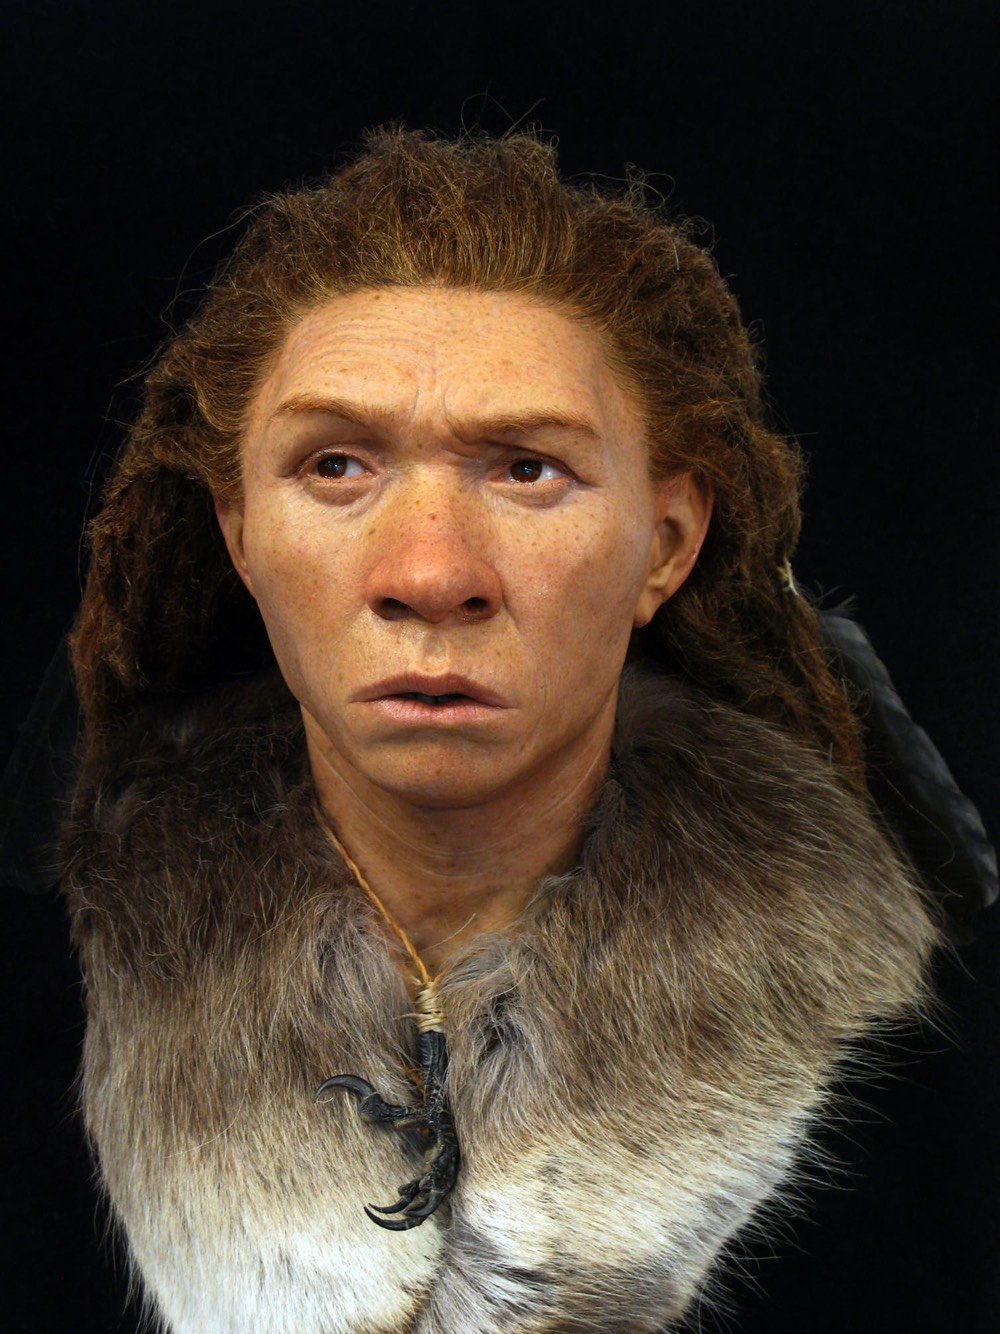
Working from remains discovered during archaeological excavations, sculptor and archaeologist Oscar Nilsson combines his two disciplines to reconstruct the faces of people who lived hundreds, thousands, and even tens of thousands of years ago.
This Neanderthal woman lived 45-50,000 years ago:
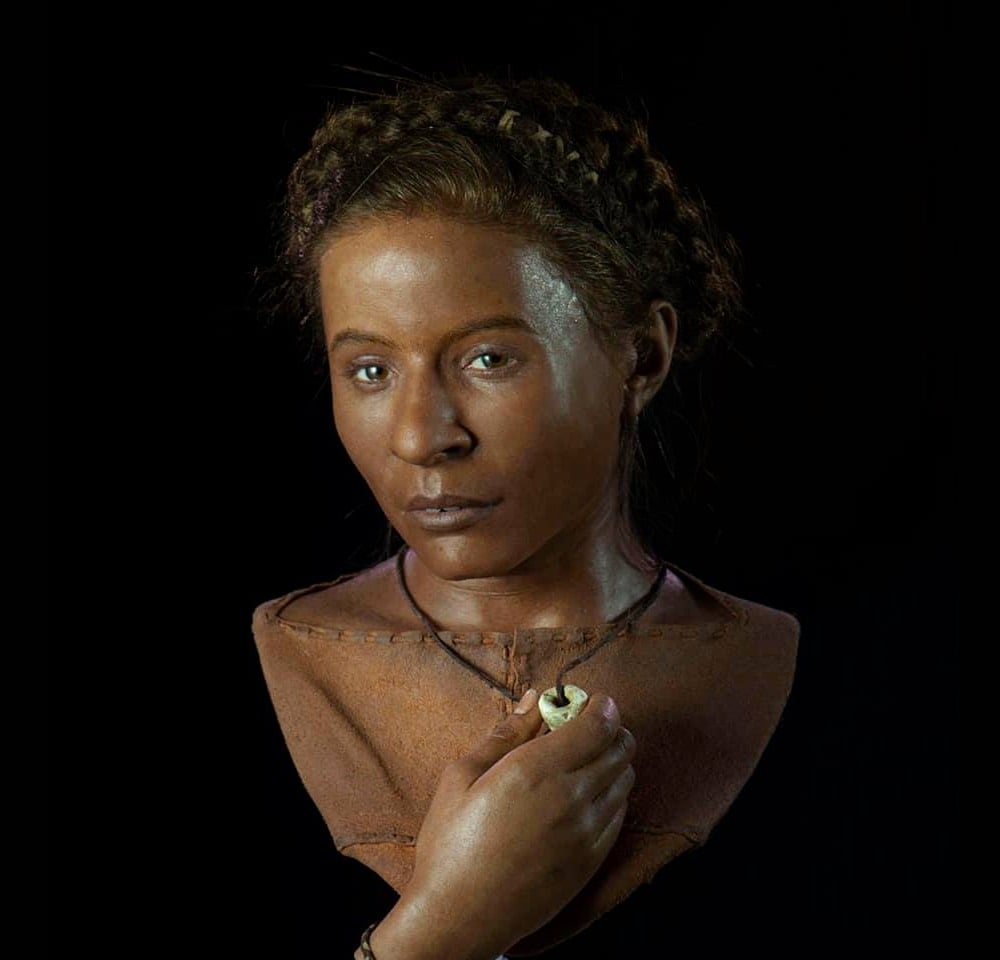
This young woman lived in what is now Britain about 5500 years ago. DNA evidence shows that the skin color of the region’s inhabitants at the time was quite dark, akin to that of modern North Africans.
This man was around 20 when he died in northern Switzerland 1300 years ago. His skull was unusual in that it contained a full set of perfect teeth.
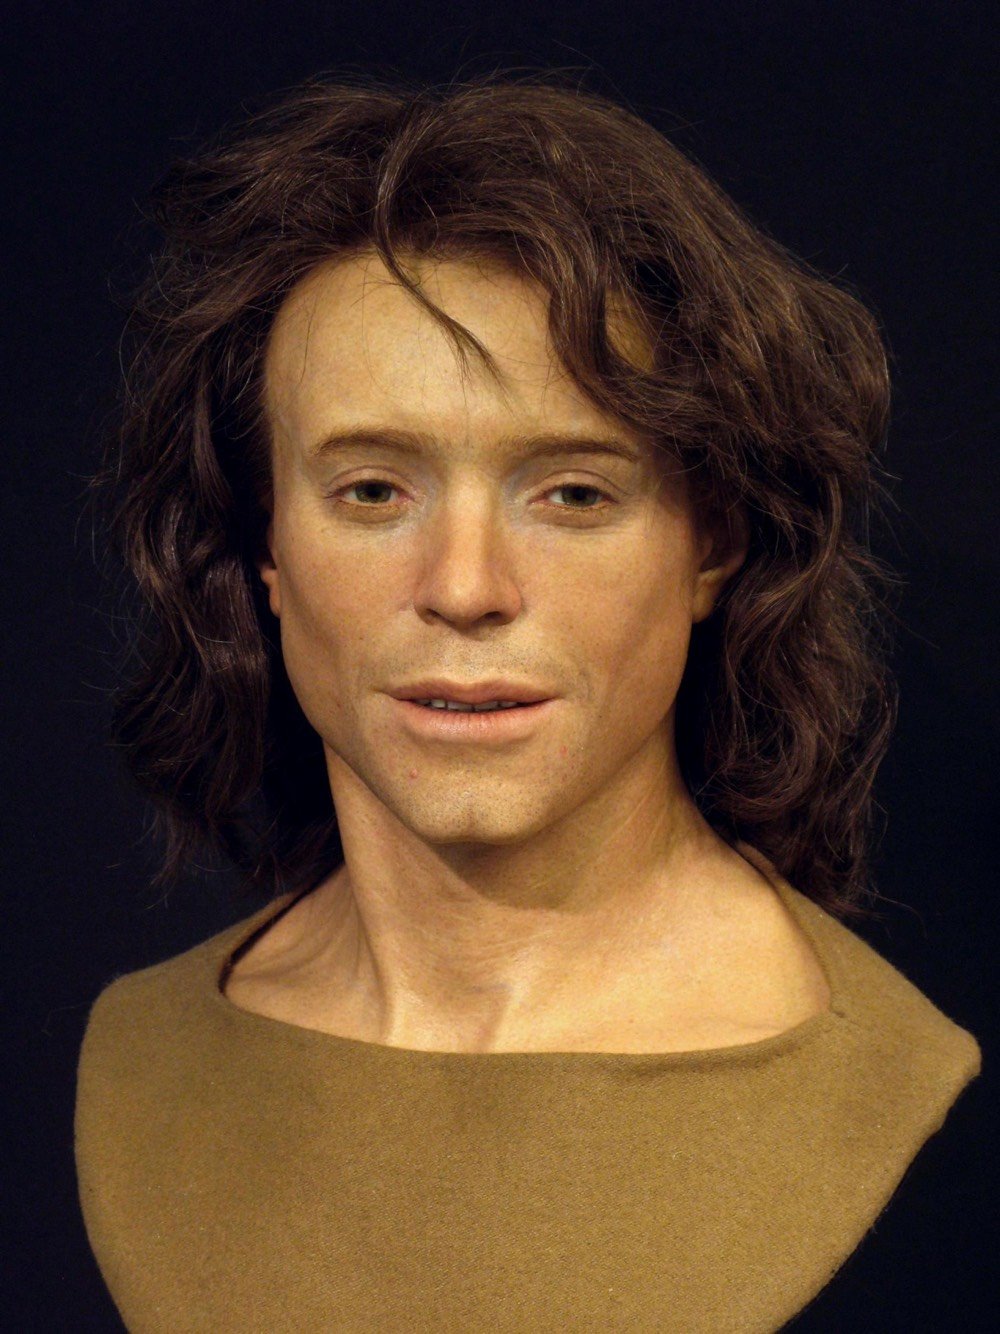
You can read more about Nilsson’s restorations at Facebook and National Geographic.
Nilsson’s forensic technique starts with an exact 3D replica of the original skull, scanned, printed, and then modeled by hand to reflect bone structure and tissue thickness based on the individual’s origin, sex, and estimated age at death.
Recent genome studies of ancient European populations enable Nilsson to outfit his reconstructions with reasonably accurate estimates of skin, hair, and eye color. The Neolithic population that the 5,600-year-old Whitehawk woman belonged to, for instance, generally had lighter skin and darker eyes than earlier occupants of Britain such as Cheddar Man, but were darker than the exhibit’s Ditchling Road man, who arrived on the island in the first wave of light-skinned, light-eyed Beaker people from continental Europe around 4,400 years ago.
Using a concept from NASA, a Finnish company called Solar Foods has figured out how to manufacture protein from carbon dioxide, water, and electricity. They call it Solein.
A company from Finland, Solar Foods, is planning to bring to market a new protein powder, Solein, made out of CO2, water and electricity. It’s a high-protein, flour-like ingredient that contains 50 percent protein content, 5-10 percent fat, and 20-25 percent carbs. It reportedly looks and tastes like wheat flour, and could become an ingredient in a wide variety of food products after its initial launch in 2021.
It’s likely to first appear on grocery shelves in protein shakes and yogurt. It could be an exciting development: Solein’s manufacturing process is carbon neutral and the potential for scalability seems unlimited — we’ve got too much CO2, if anything. Why not get rid of some greenhouse gas with a side of fries?
The production of food (and the protein contained in meat in particular) is responsible for a large percentage of our planet’s changing climate, so if Solein pans out, it could be a huge development. It will be interesting to see if the wizards or prophets win the battle to “fix” climate change…Solein is one hell of a salvo by the wizards.
It’s nothing new for people who built tools to later have remorse when seeing those tools abused. Sometimes that remorse is world-historical, like with many of the scientists whose work led to the atom bomb. Sometimes, it’s something less than that, like the guy who built the retweet button for Twitter.
In the retweet button’s case, this guy is named Chris Wetherell. He’s also responsible for leading the team that built Google Reader. This is usually posed as an irony: the guy who built a thing that’s now loathed and everywhere (the retweet) also built the thing that’s beloved after its death. But to me, it’s not so ironic.
See, what Wetherell did in both cases was less invent something from whole cloth than adapt a user behavior (manual retweets and RSS readers) into part of a corporate product. In both case, the corporate versions of each were so successful that they crowded out the original forms of user behavior. The retweet got lucrative but ugly, the RSS reader enabled all new kinds of connections, but grew costly. The retweet lived and Reader died, but the underlying pattern was the same; once it was handed over to the corporation, everyone lost control.
And I think you can argue that there’s a parallel here too with the atom bomb folks. Few of them were upset that the structure of the universe works the way their theories predicted. What terrified them was putting the tremendous power inherent in the structure of the universe at the behest of the state.
This is the builder’s remorse. Not that you invented a thing, not that the consequences were unforeseen. It’s that you gave the thing to a power structure where things were overwhelmingly likely to end in ruin. You gave the power to people who don’t care about what you claim to care about. And that problem, because of the nature and structure of money and power, is extremely hard to avoid.
I was away this weekend at a family function and mostly without internet access, so I didn’t get to watch the coverage of the Moon landing for the first time in more than a decade. I also didn’t get to share a bunch of links I had up in browser tabs and now I think everyone is (justifiably) tired of all the Apollo 11 hoopla, myself included. But I hope you’ll indulge me in just one more and then I’ll (maybe! hopefully!) shut up about it for another year.
It’s tough to narrow it down, but the most dramatic & harrowing part of the whole mission is when Neil Armstrong notices that the landing site the LM (call sign “Eagle”) is heading towards is no good — it’s too rocky and full of craters — so he guides the spacecraft over that area to a better landing spot. He does this despite never having flown the LM that way in training, with program alarms going off, with Mission Control not knowing what he’s doing (he doesn’t have time to tell them), and with very low fuel. Eagle had an estimated 15-20 seconds of fuel left when they touched down and the guy doing the fuel callouts at Mission Control was basically just estimating the remaining fuel in his head based on how much flying he thinks the LM had done…and again, the LM had never been flown like that before and Mission Control didn’t know what Armstrong was up to! (The 13 Minutes to the Moon podcast does an excellent job explaining this bit of the mission, episode 9 in particular.)
Throughout this sequence, there was a camera pointed out Buzz Aldrin’s window — you can see that video here — but that was a slightly different view from Armstrong’s. We’ve never seen what Armstrong saw to cause him to seek out a new landing site. Now, a team at NASA has simulated the view out of his window using data from the Lunar Reconnaissance Orbiter Camera:
The LROC team reconstructed the last three minutes of the landing trajectory (latitude, longitude, orientation, velocity, altitude) using landmark navigation and altitude call outs from the voice recording. From this trajectory information, and high resolution LROC NAC images and topography, we simulated what Armstrong saw in those final minutes as he guided the LM down to the surface of the Moon. As the video begins, Armstrong could see the aim point was on the rocky northeastern flank of West crater (190 meters diameter), causing him to take manual control and fly horizontally, searching for a safe landing spot. At the time, only Armstrong saw the hazard; he was too busy flying the LM to discuss the situation with mission control.
This reconstructed view was actually pretty close to the camera’s view out of Aldrin’s window:
See also a photograph of the Apollo 11 landing site taken by the LRO camera from a height of 15 miles.
The Apollo Flight Journal has put together a 20-minute video of the full descent and landing of the Apollo 11 Lunar Module containing Neil Armstrong and Buzz Aldrin on July 20, 1969.
The video combines data from the onboard computer for altitude and pitch angle, 16mm film that was shot throughout the descent at 6 frames per second. The audio recording is from two sources. The air/ground transmissions are on the left stereo channel and the mission control flight director loop is on the right channel. Subtitles are included to aid comprehension.
Reminder that you can follow along in sync with the entire Apollo 11 mission right up until their splashdown. I am also doing my presentation of Walter Cronkite’s CBS news coverage of the landing and the Moon walk again this year, starting at 4:10pm EDT on Saturday, July 20. Here’s the post I wrote about it last year for more details. (thx, david)
The YouTube channel Primer is running a series on evolution and how it works. Topics include mutations, selfish genes, and altruism in natural selection. The most popular video of the series is this one on the simulation of natural selection:
In it, you can see how different environments cause groups to tend towards certain traits (size, speed, sensing ability) based on food availability, with random mutation and reproduction in the mix as well. Seeing the populations’ traits change in realtime as the generations pass is a powerful way to make sense of a complex concept.

A team of researchers at the Laboratory for NeuroImaging of Coma and Consciousness have done an ultra-high resolution MRI scan of a human brain. The scan took 100 hours to complete and can distinguish objects as small as 0.1 millimeters across.
“We haven’t seen an entire brain like this,” says electrical engineer Priti Balchandani of the Icahn School of Medicine at Mount Sinai in New York City, who was not involved in the study. “It’s definitely unprecedented.”
The scan shows brain structures such as the amygdala in vivid detail, a picture that might lead to a deeper understanding of how subtle changes in anatomy could relate to disorders such as post-traumatic stress disorder.
This video above shows the scanned slices of the entire brain from side to side.
You can view/download the entire dataset of images here.
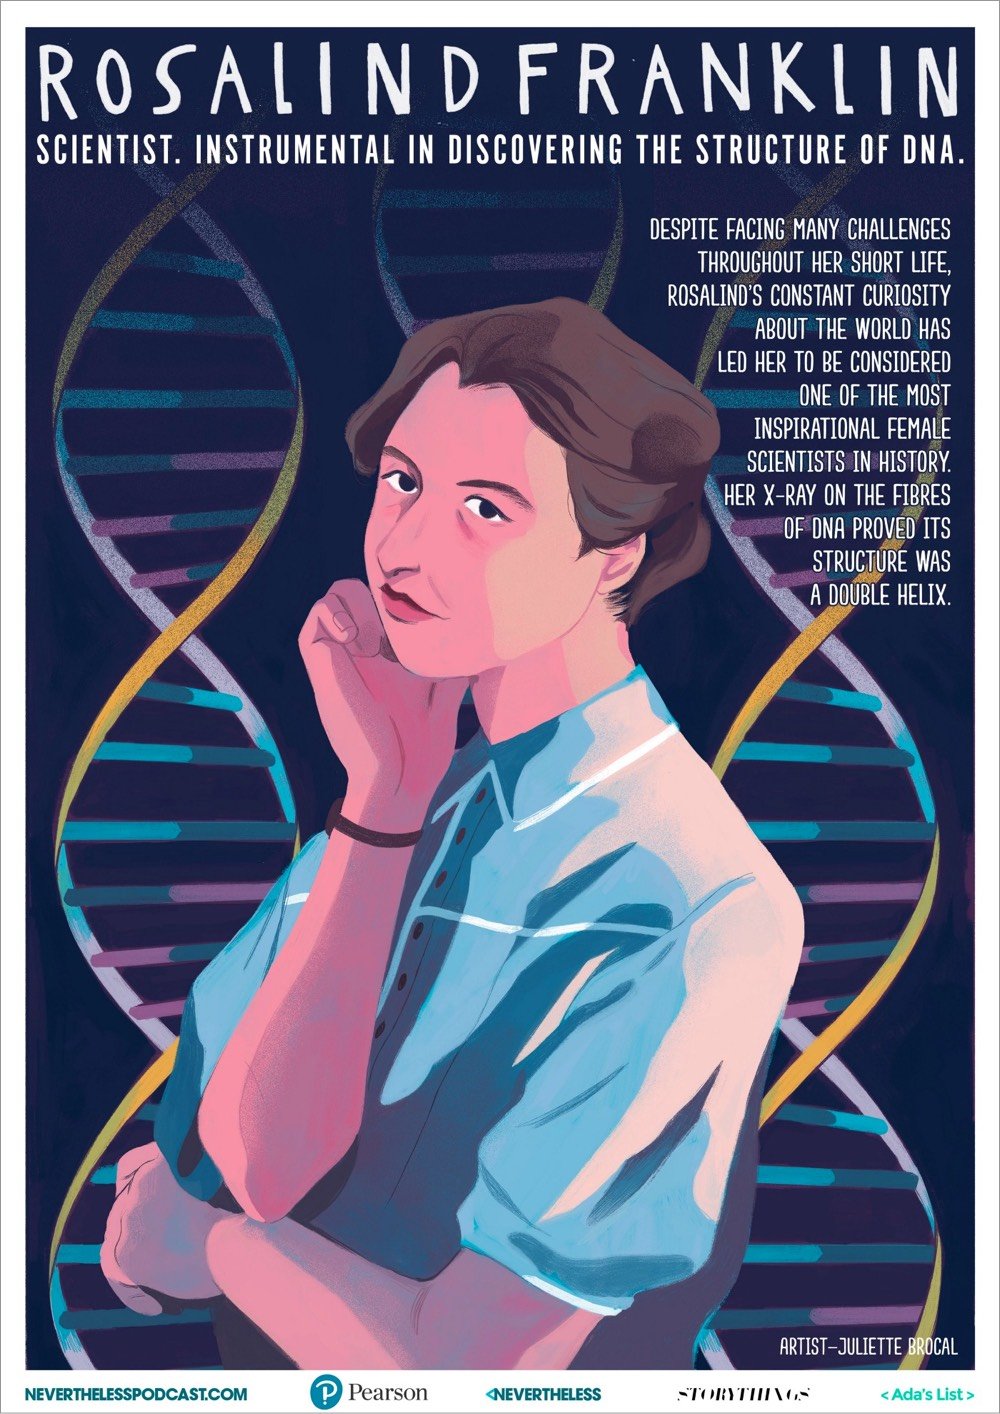
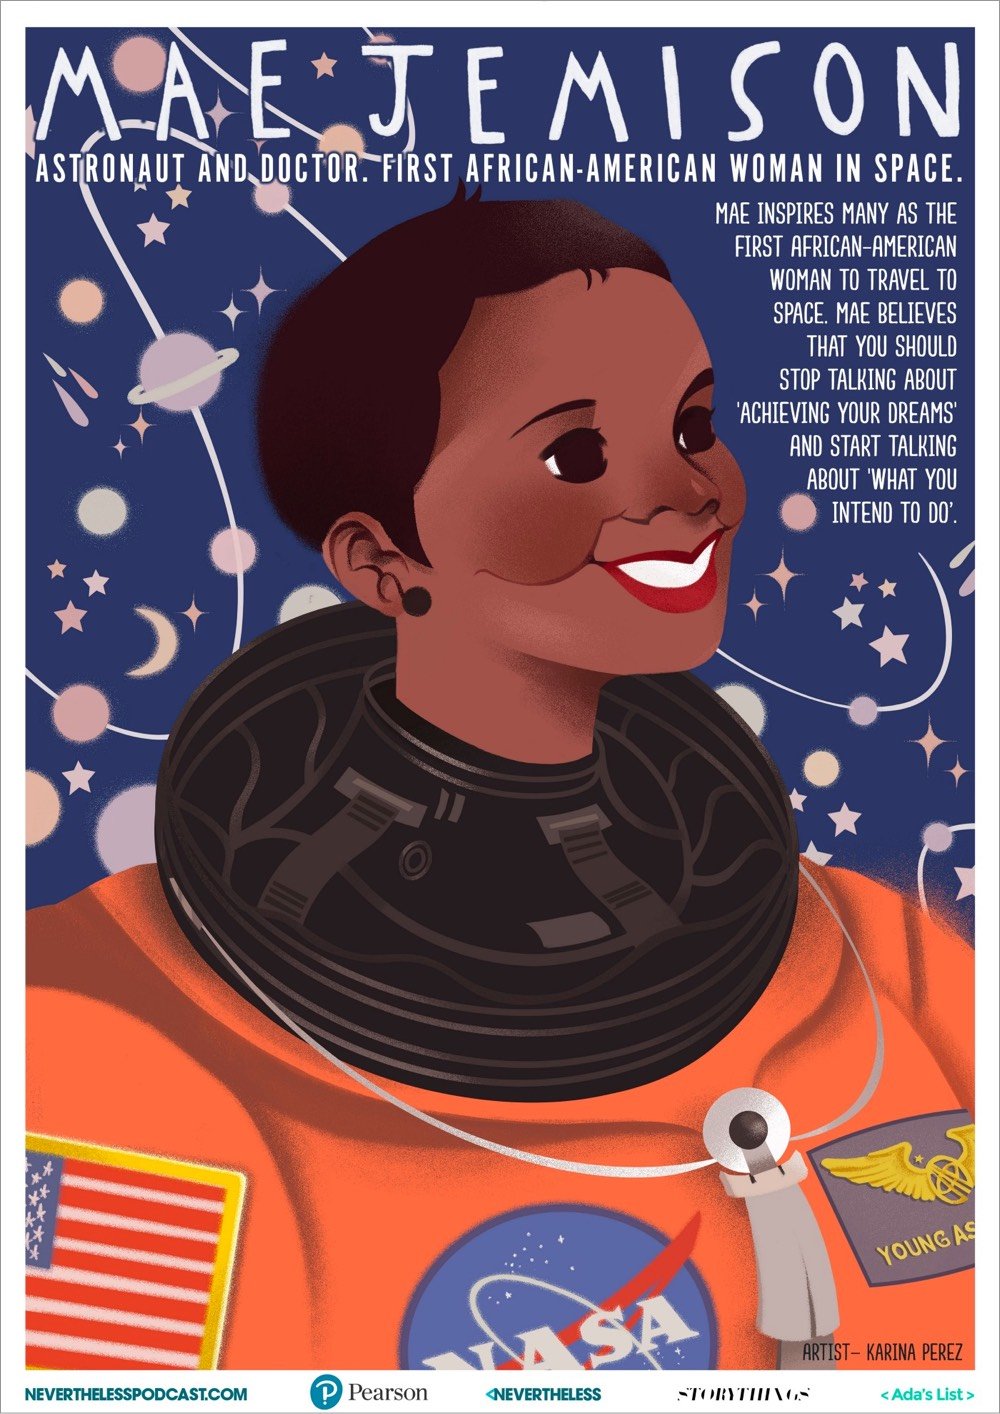
The folks behind the Nevertheless podcast commissioned a set of seven posters of STEM role models, people who have made significant contributions to science, technology, engineering, and mathematics. The posters are free to download and print out in eight different languages (including English, Spanish, and Simplified Chinese).
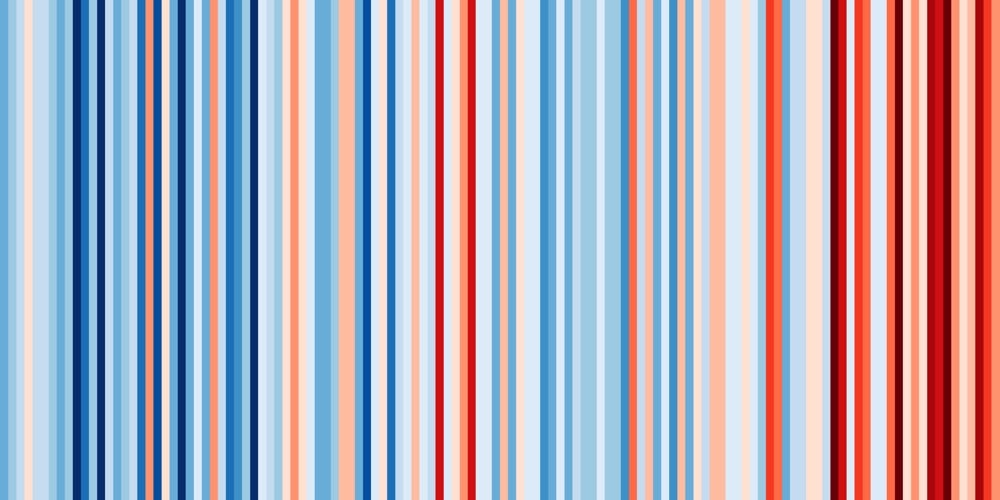
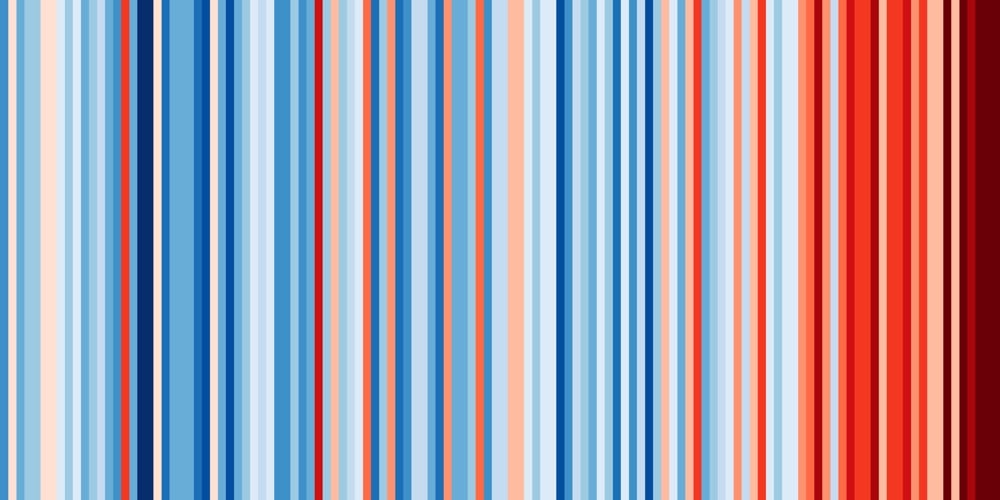
Using temperature data from around the world, climate scientist Ed Hawkins has built a tool for viewing the “climate stripes” for almost any location, a data visualization that represents the change in temperature over time over the past 100+ years. For most locations, the graphs shift from blues to oranges & reds as the climate warms, neatly illustrated by the global graph:

Here’s Vermont (where I live) and Arizona:
You can see there’s more variation on the regional level than globally. Check out the graph for Mississippi:
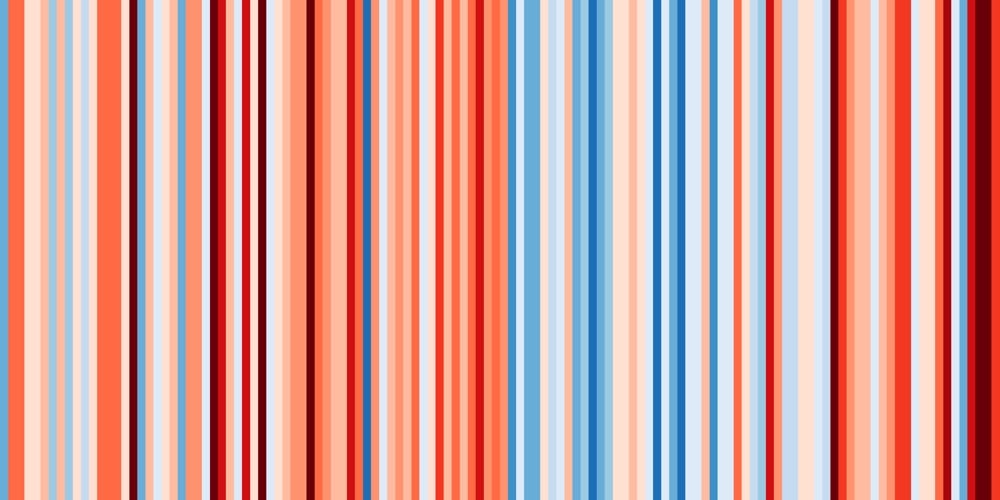
The warming patterns for particular regions are not going to be uniform…some places are actually forecast to get cooler and wetter rather than hotter and dryer. You can create and download your own climate stripes here…perhaps you can use it to make a global warming blanket. (via riondotnu)
From National Geographic comes The Atlas of Moons, an interactive reference to all of the major moons in our solar system, from the Earth’s own moon to the Galilean moons of Jupiter to Charon, which forms a binary system with Pluto.
For whatever reason, I wasn’t fully aware that some of Jupiter’s and Saturn’s major moons orbited their planets so quickly — Europa takes 3.6 days to complete an orbit, Io once every 1.8 days, and Mimas speeds around Saturn every 22.6 hours.
According this video by Kurzgesagt (and their extensive list of sources), the answer to that question for now is: no, our electronic devices are not causing long- or short-term health problems in the brains or bodies of people who use them.
Electrosmog is one of those things that is a bit vague and hard to grasp. When personal health is involved, feelings clash extra hard with scientific facts and there is a lot of misinformation and exaggeration out there. On the other hand, some people are really worried and distressed by the electricity that surrounds them. And just to wave this off is not kind or helpful.
While there is still a lot of researching being done on the dangers of constant weak electromagnetic radiation, it is important to stress that so far, we have no reason to believe that our devices harm us. Other than… well… spending too much time with them.
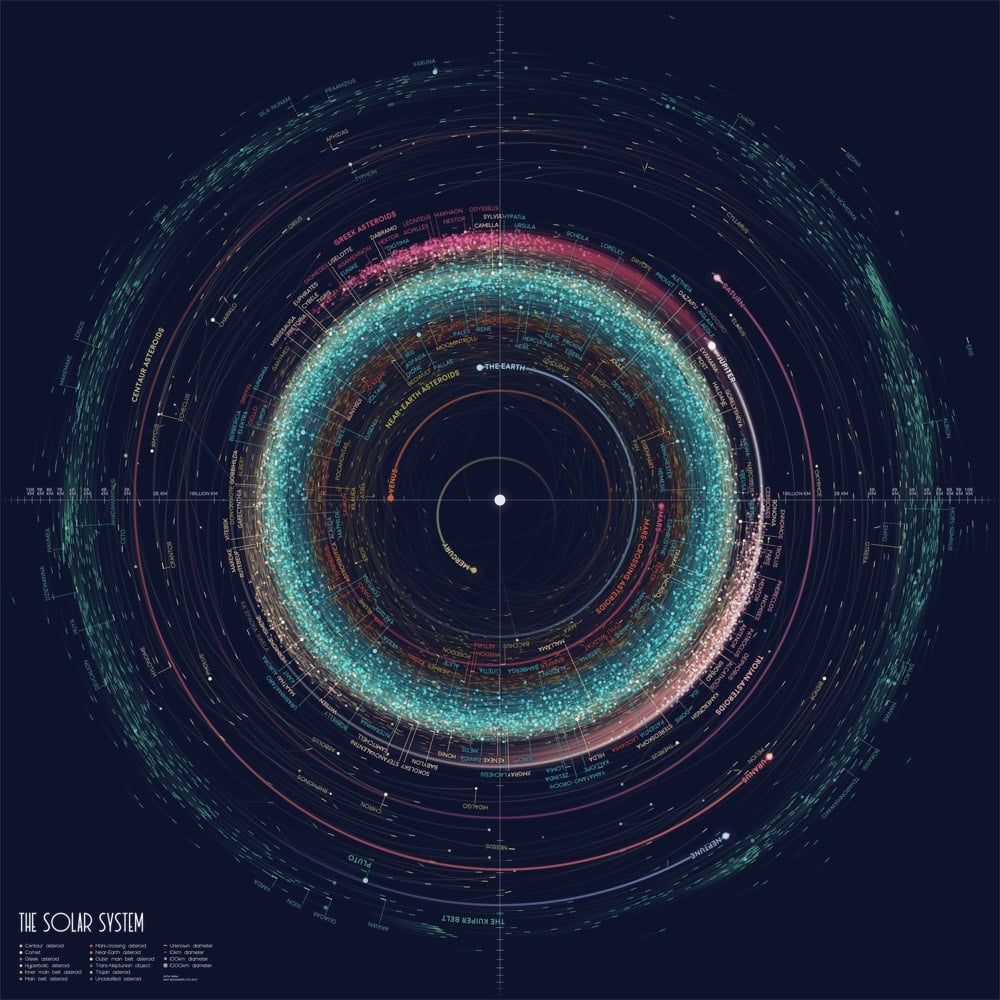
Remember how last week I told you about Eleanor Lutz’s An Atlas of Space?
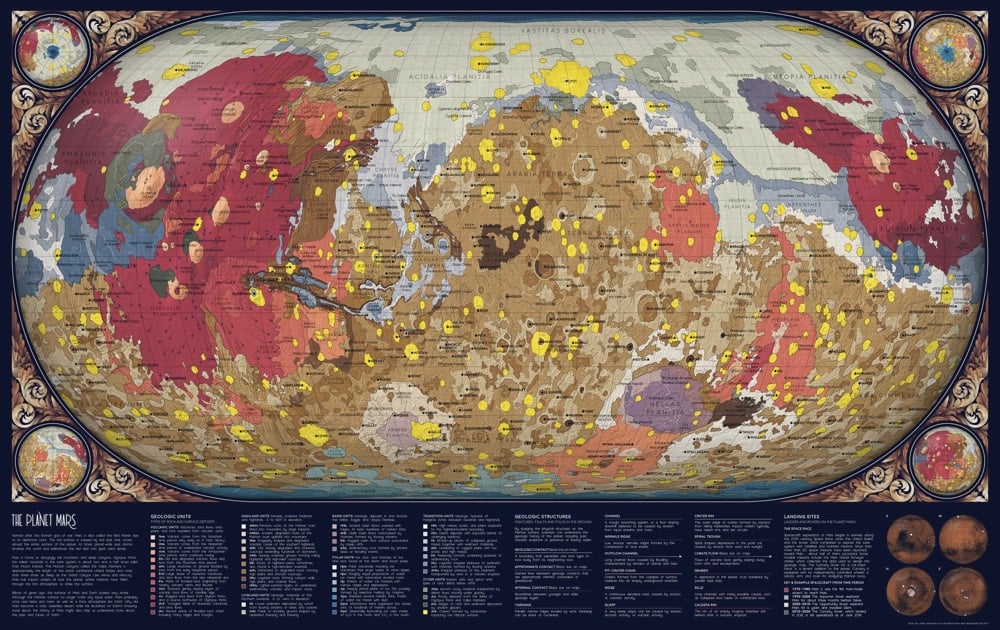
Over the past year and a half I’ve been working on a collection of ten maps on planets, moons, and outer space. To name a few, I’ve made an animated map of the seasons on Earth, a map of Mars geology, and a map of everything in the solar system bigger than 10km.
Well, she’s posted her first two projects: An Orbit Map of the Solar System (a map of more than 18,000 asteroid orbits in the solar system) and A Topographic Map of Mercury.

As promised, Lutz has posted the source code for each project to her GitHub account: Mercury topography, asteroid orbits. What a great resource for aspiring data visualization designers. Stay tuned to her site, Twitter, or Tumblr for upcoming installments of the atlas.
Update: Lutz’s third map in the series is out: The Geology of Mars. And here’s the link to the code and how-to on Github.
Update: Lutz’s fourth map has been released: an animated map of the Earth cycling through all four seasons. Link to the code on GitHub.
Also, she’s made high-res wallpapers available for download in a number of different aspect ratios…check out the links at the bottom of the post.
Update: Today’s installment of the atlas presents a view from our solar system: The Western Constellations (source code on Github).
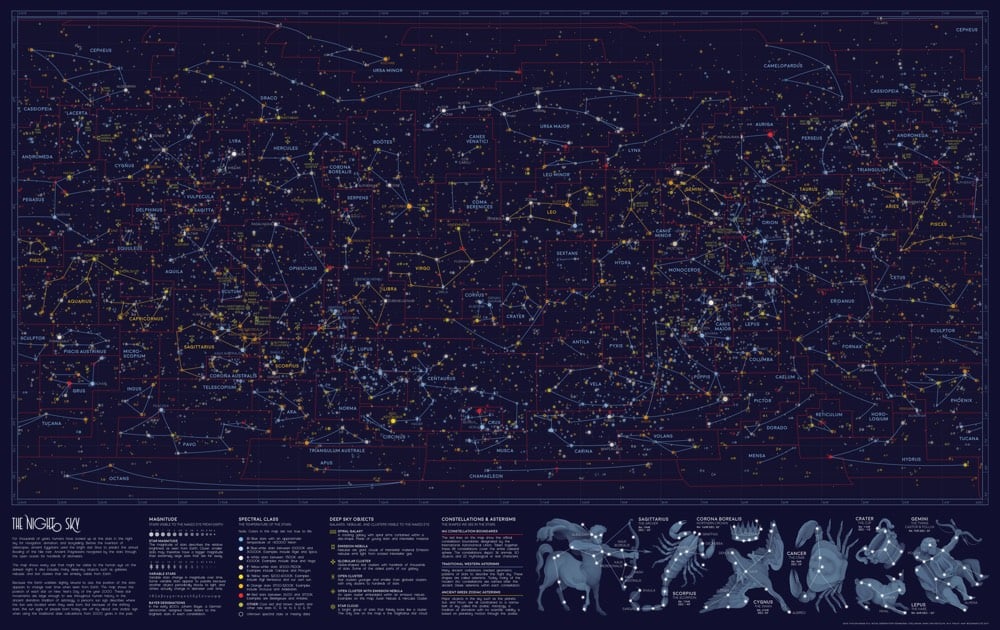
This week’s map shows every single star visible from Earth, on the darkest night with the clearest sky. The map also includes all of the brightest galaxies, nebulae, and star clusters from W.H. Finlay’s Concise Catalog of Deep-sky Objects. I illustrated the familiar Western star patterns — or asterisms — in blue and gold, as well as the scientific constellation boundaries in red.
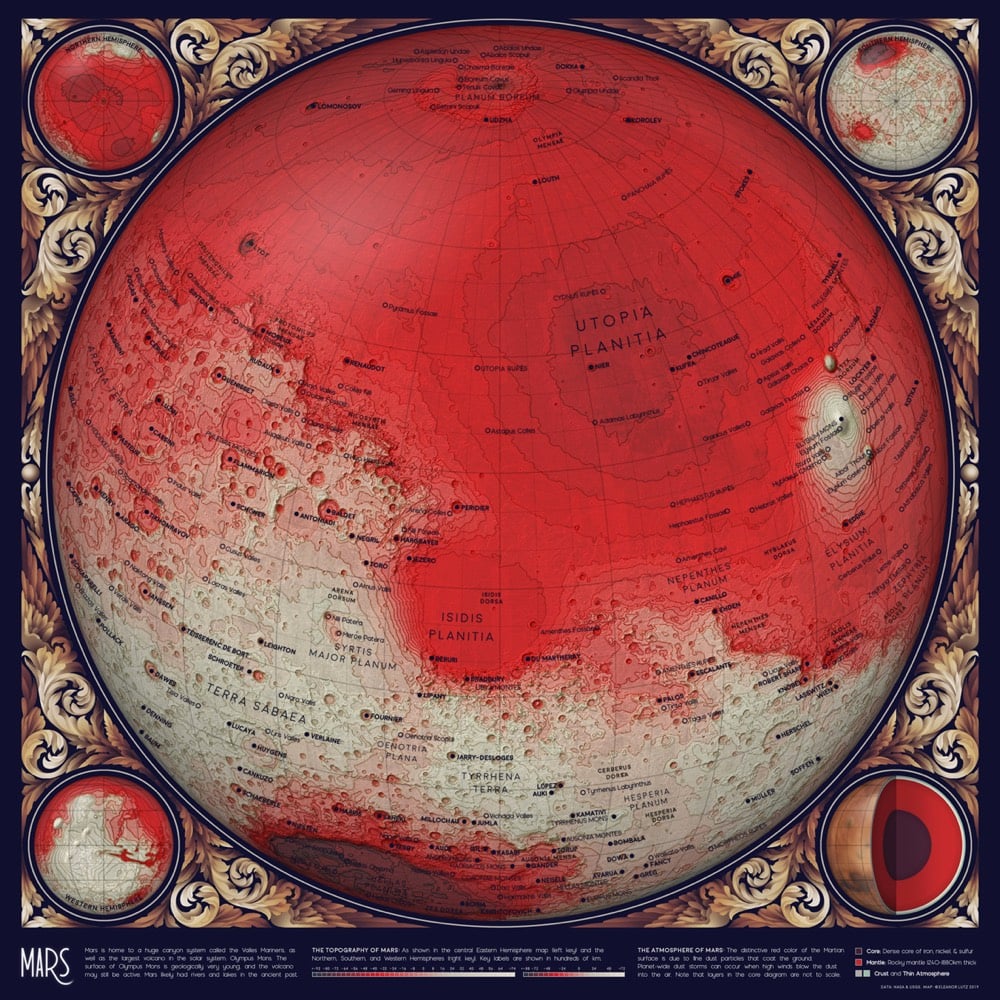
Update: Holy moly, I think Lutz’s Topographic Map of Mars might be her most beautiful one yet.
Update: I couldn’t keep up with all of Lutz’s additions to her atlas. You can check out all of the installments in the archive, including the last part (for now), The Geology of the Moon.
Newer posts
Older posts
Socials & More