The NY Times’ Paper Cuts blog calls Cartographies of Time “the most beautiful book of the year”. I cannot disagree. In attempting to answer the question “how do you draw time?”, the authors present page after page of beautiful and clever visual timelines.
Cartographies of Time is the first comprehensive history of graphic representations of time in Europe and the United States from 1450 to the present. Authors Daniel Rosenberg and Anthony Grafton have crafted a lively history featuring fanciful characters and unexpected twists and turns. From medieval manuscripts to websites, Cartographies of Time features a wide variety of timelines that in their own unique ways-curving, crossing, branching-defy conventional thinking about the form. A fifty-four-foot-long timeline from 1753 is mounted on a scroll and encased in a protective box. Another timeline uses the different parts of the human body to show the genealogies of Jesus Christ and the rulers of Saxony. Ladders created by missionaries in eighteenth-century Oregon illustrate Bible stories in a vertical format to convert Native Americans. Also included is the April 1912 Marconi North Atlantic Communication chart, which tracked ships, including the Titanic, at points in time rather than by their geographic location, alongside little-known works by famous figures, including a historical chronology by the mapmaker Gerardus Mercator and a chronological board game patented by Mark Twain. Presented in a lavishly illustrated edition, Cartographies of Time is a revelation to anyone interested in the role visual forms have played in our evolving conception of history.
Phil Gyford’s spot-on critique of the number and quality of infographics currently choking the web. As Phil notes, far too many infographics decorate and don’t communicate.
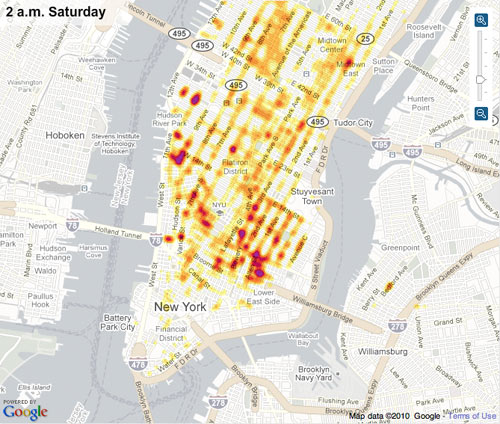
From a study on how people use Firefox, a heat map that highlights the most- and least-popular menu items. Bookmarks got the most use by far, followed by copy and paste. Copy was used about twice as much as paste, which suggests that about 50% of the time, people are copying things to be pasted into another program. Oh and not a single person used “Redo”. (via ben fry)
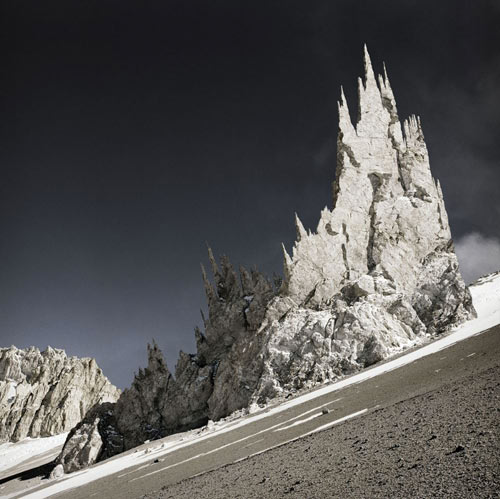
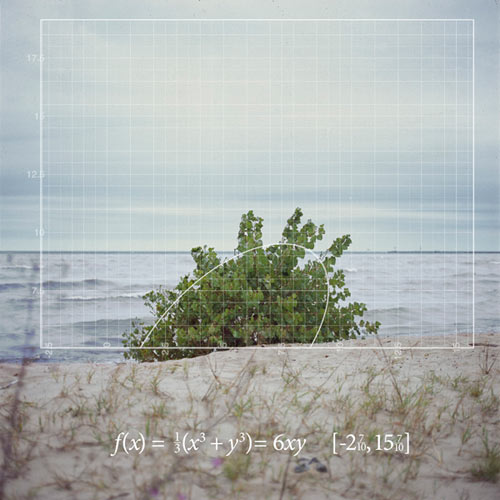
Photographer Michael Najjar took some of his photos from the Andes and turned them into stock market infographics. Here’s Lehman Brothers stock price from 1980 to 2008.
Boy, their stock price really fell off a cliff there, didn’t it? The rest of the series is worth a look as well, although Najjar’s site features the worst use of Flash I’ve seen in many months…it automatically fullscreens and generally wastes a bunch of time with transitions. To find the rest of the photos, wait until the map starts loading and put your mouse at the bottom of the screen. A menu will s.l.o.w.l.y. slide up…High Altitude is what you’re looking for. (via info aesthetics)
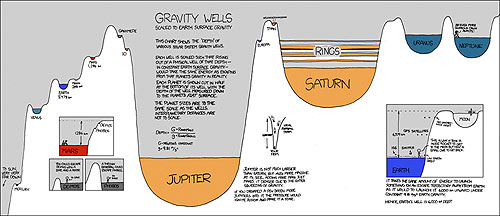
A representation of how deep the Mariana Trench is. Turns out it’s really, really, really, really, really, really, really, really, really, really, really, really, really deep. (via df)
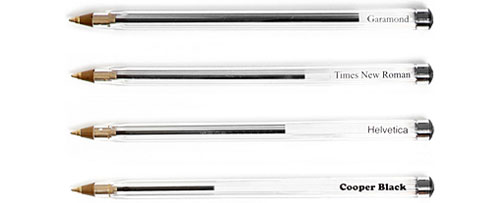
Clever idea: you can measure the amount of ink required to print different typefaces simply by writing them out with ballpoint pens. The pens themselves become the usage graph:
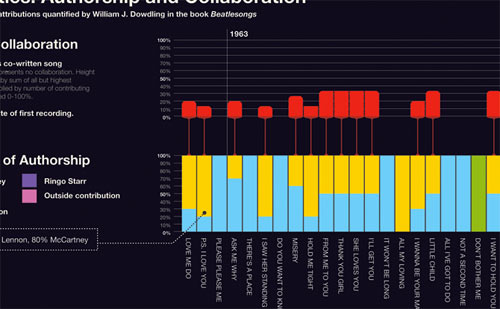
The most interesting of several infographics related to The Beatles is the first one depicting the declining rate of collaboration within the band gleaned from songwriting credit data.
This clever graph by National Geographic shows the cost of healthcare compared to life expectancy in a number of countries. The way that the US healthcare expenditure is pictured entirely outside the confines of the graph’s scale and legend is a particularly effective design decision. (thx, jim)
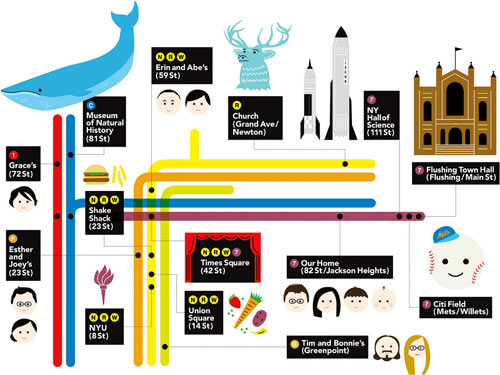
This was my present to my nephew for his 3rd birthday. He loves, loves, loves the subway so my sister asked me if I could make a custom map with all the places that mean something to him on the poster.
Note: If you are a member and tried to log in, it didn't work, and now you're stuck in a neverending login loop of death, try disabling any ad blockers or extensions. Or try logging out and then back in. Still having trouble? Email me!


Socials & More