kottke.org posts about Eleanor Lutz
Remember how last week I told you about Eleanor Lutz’s An Atlas of Space?
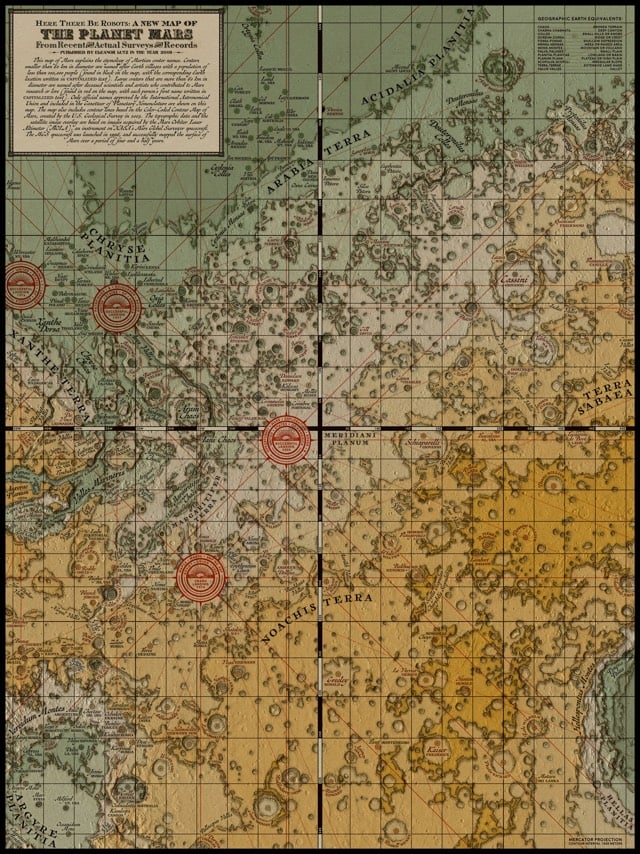
Over the past year and a half I’ve been working on a collection of ten maps on planets, moons, and outer space. To name a few, I’ve made an animated map of the seasons on Earth, a map of Mars geology, and a map of everything in the solar system bigger than 10km.
Well, she’s posted her first two projects: An Orbit Map of the Solar System (a map of more than 18,000 asteroid orbits in the solar system) and A Topographic Map of Mercury.
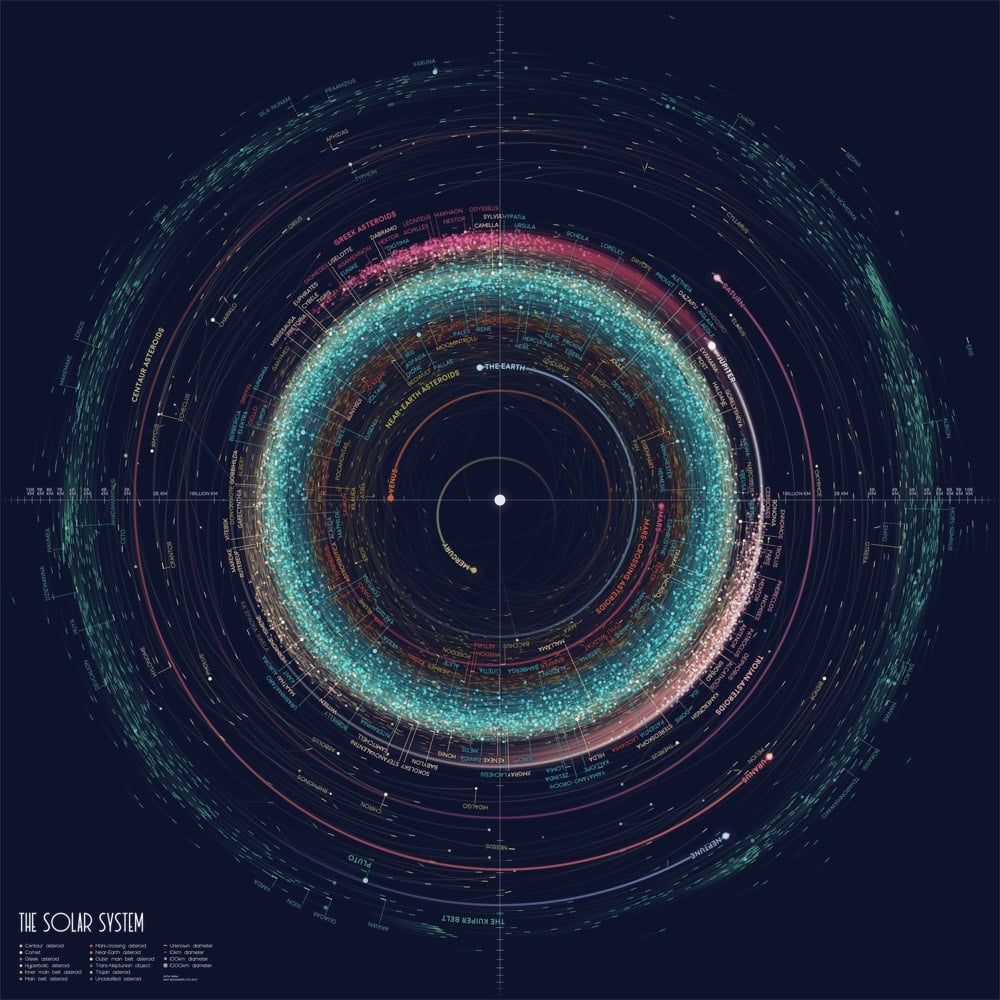
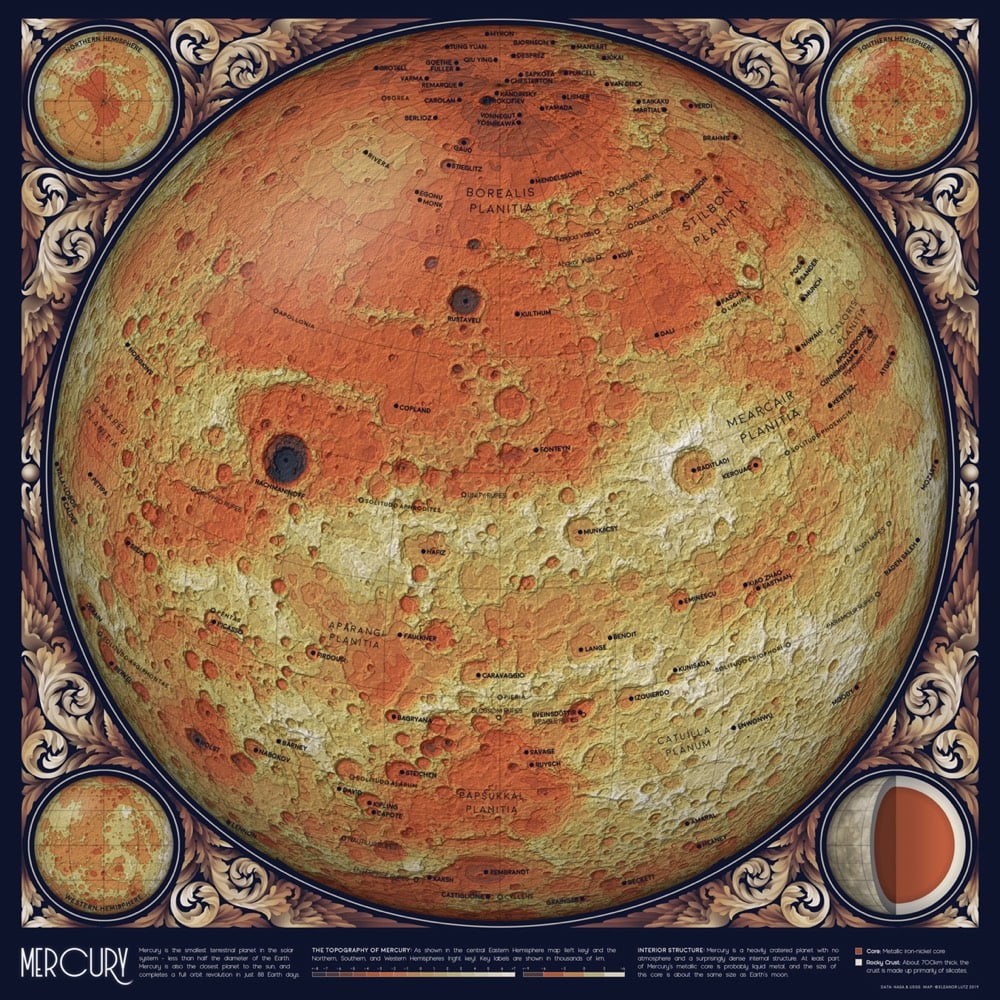
As promised, Lutz has posted the source code for each project to her GitHub account: Mercury topography, asteroid orbits. What a great resource for aspiring data visualization designers. Stay tuned to her site, Twitter, or Tumblr for upcoming installments of the atlas.
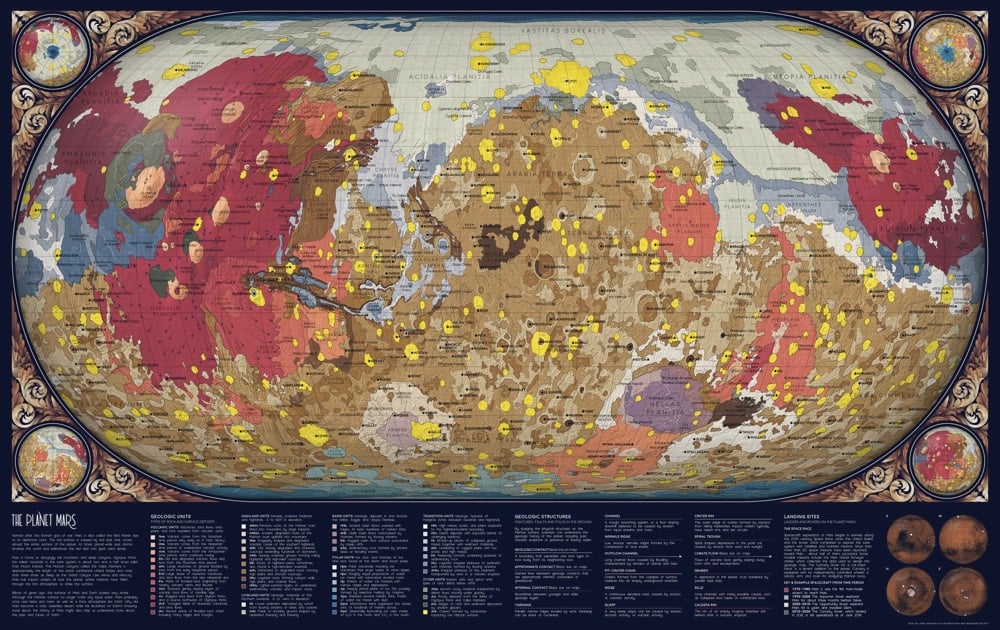
Update: Lutz’s third map in the series is out: The Geology of Mars. And here’s the link to the code and how-to on Github.
Update: Lutz’s fourth map has been released: an animated map of the Earth cycling through all four seasons. Link to the code on GitHub.
Also, she’s made high-res wallpapers available for download in a number of different aspect ratios…check out the links at the bottom of the post.
Update: Today’s installment of the atlas presents a view from our solar system: The Western Constellations (source code on Github).
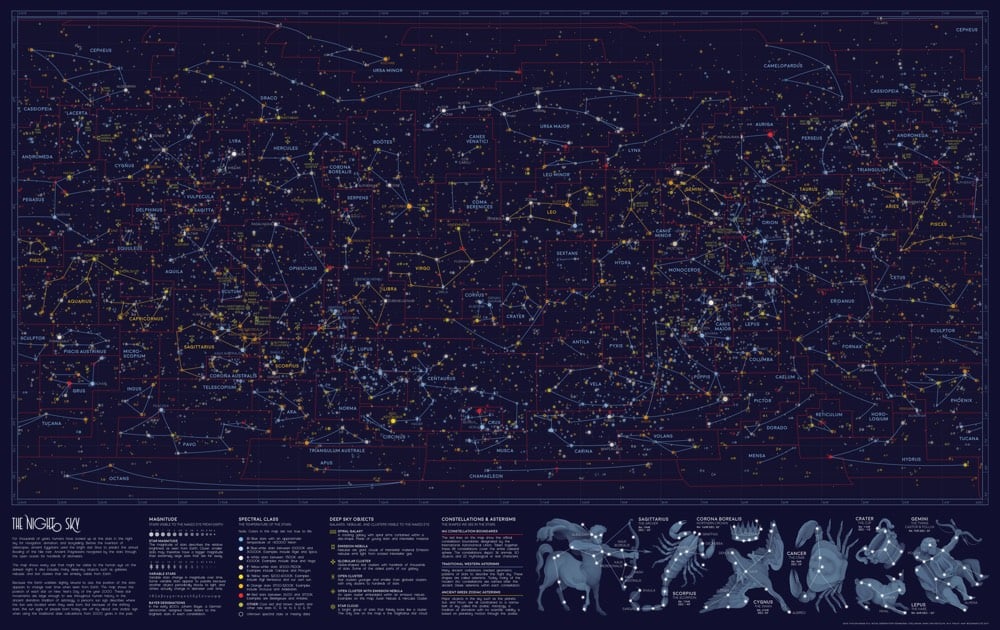
This week’s map shows every single star visible from Earth, on the darkest night with the clearest sky. The map also includes all of the brightest galaxies, nebulae, and star clusters from W.H. Finlay’s Concise Catalog of Deep-sky Objects. I illustrated the familiar Western star patterns — or asterisms — in blue and gold, as well as the scientific constellation boundaries in red.
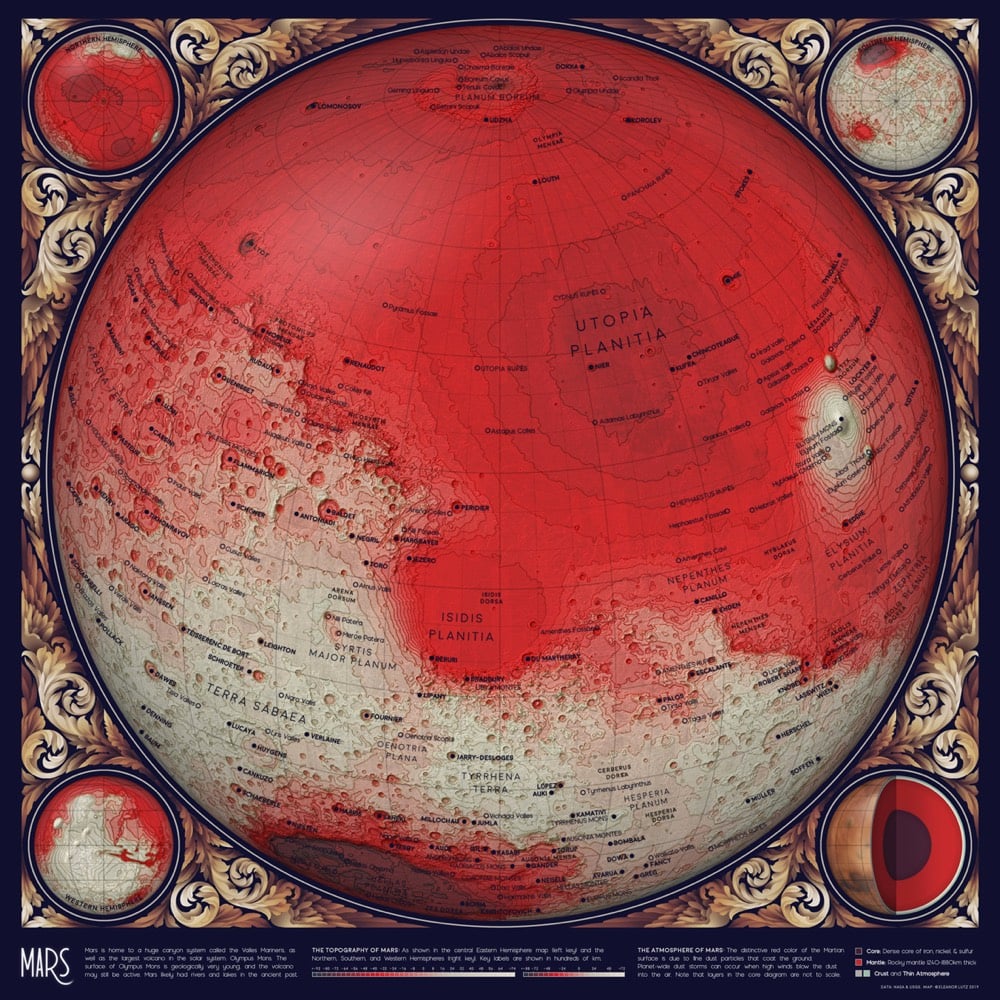
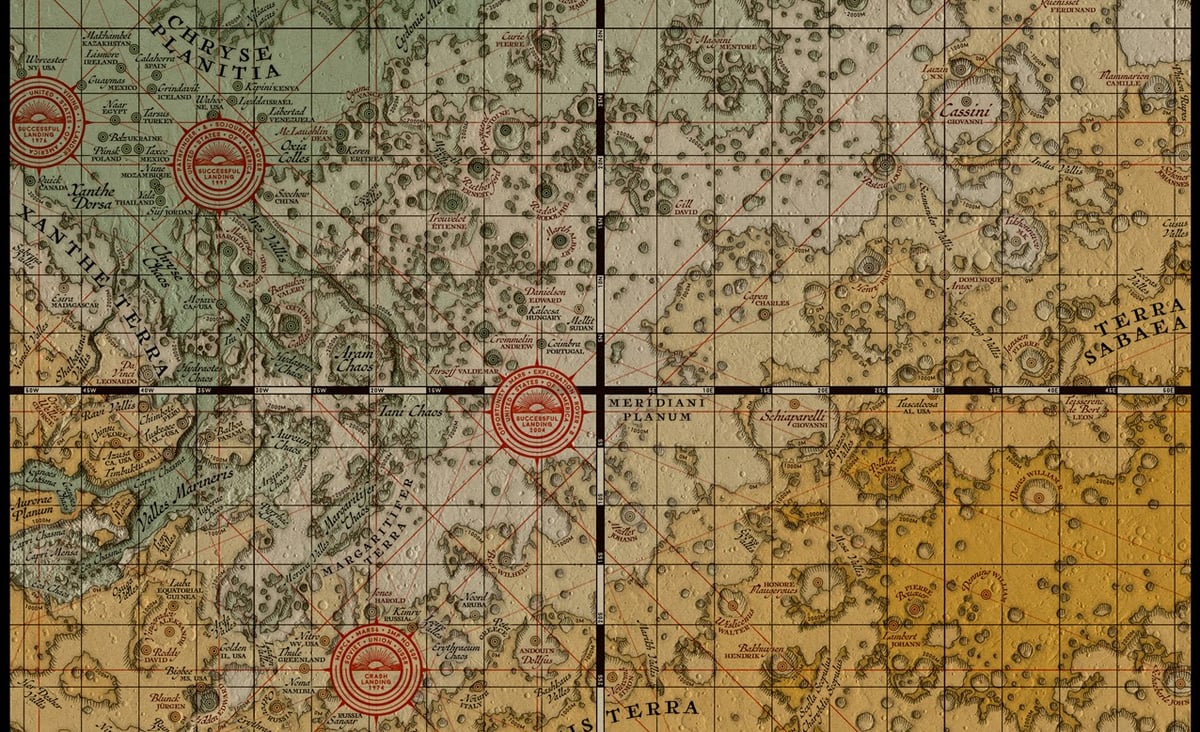
Update: Holy moly, I think Lutz’s Topographic Map of Mars might be her most beautiful one yet.
Update: I couldn’t keep up with all of Lutz’s additions to her atlas. You can check out all of the installments in the archive, including the last part (for now), The Geology of the Moon.
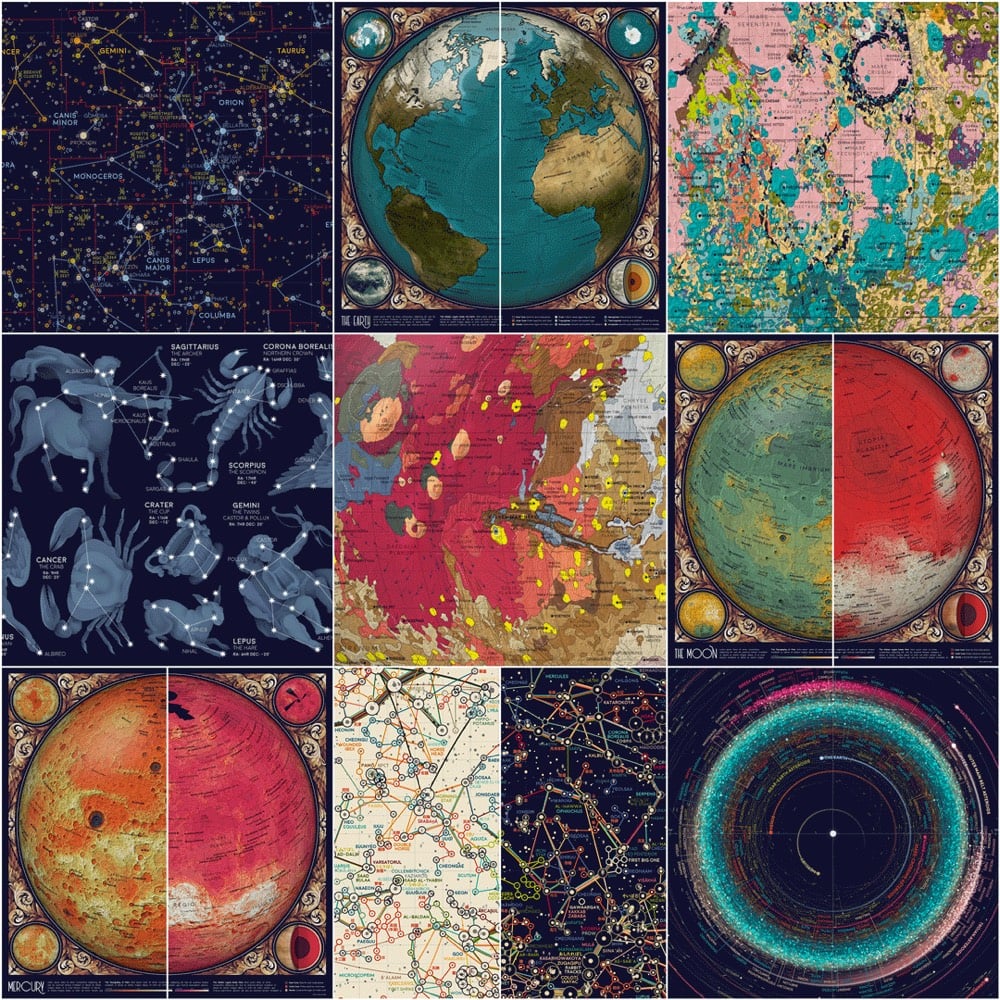
Eleanor Lutz is one of my favorite data visualizers (previously) and she’s about ready to drop her new project: An Atlas of Space.
I’m excited to finally share a new design project this week! Over the past year and a half I’ve been working on a collection of ten maps on planets, moons, and outer space. To name a few, I’ve made an animated map of the seasons on Earth, a map of Mars geology, and a map of everything in the solar system bigger than 10km.
Over the next few weeks I want to share each map alongside the open-source Python code and detailed tutorials for recreating the design. All of the astronomy data comes from publicly available sources like NASA and the USGS, so I thought this would be the perfect project for writing design tutorials (which I’ve been meaning to do for a while).
Ahhh, look at those colors! Lutz is going to be posting a new map from the project periodically over the next few weeks so follow her on Tabletop Whale, Twitter, or Tumblr to tune in.
Update: I’m keeping track of the projects that make up the atlas as they are released in updates to this post.
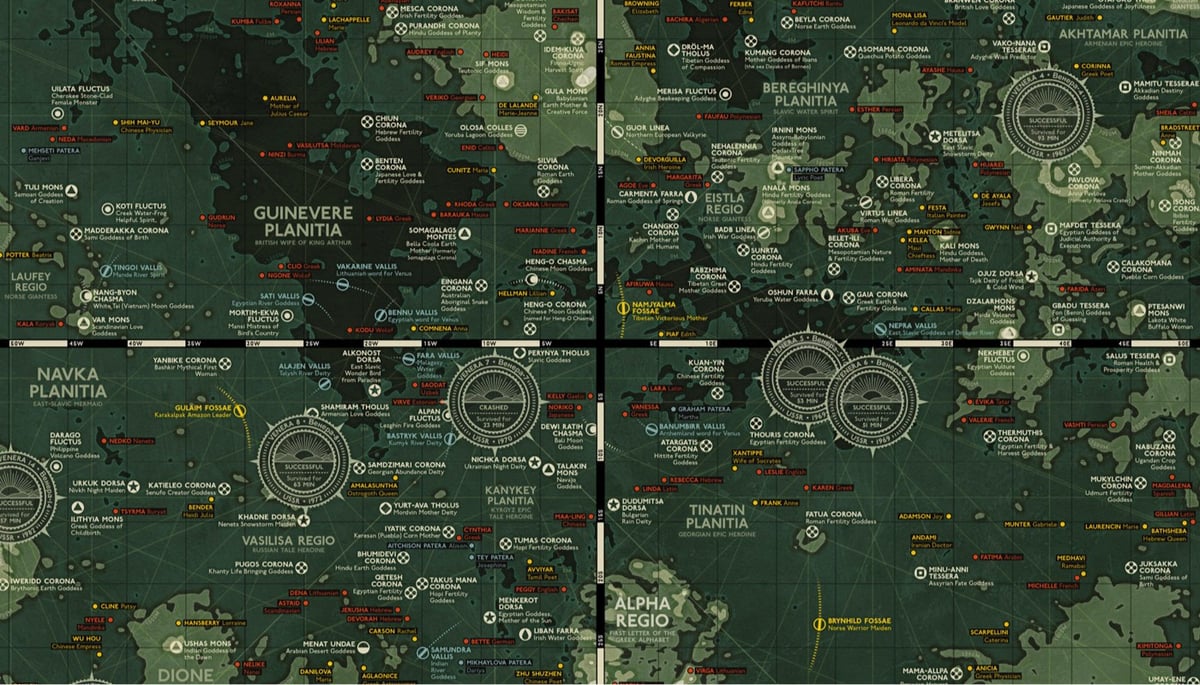
Last year, Eleanor Lutz made a medieval-style map of Mars. As a follow-up, she’s made a topographical map of Venus. The features on Venus are named for female mythological figures & notable women and Lutz provides a small biography for each one on the map. Among those featured on the map are:
Anne Frank
Selu (Cherokee Corn Goddess)
Kali (Hindu Goddess, Mother of Death)
Virginia Woolf
Sedna (Eskimo Whose Fingers Became Seals and Whales)
Ubastet (Egyptian Cat Goddess)
Beatrix Potter
Edith Piaf
Here are the full lists of the craters, mountains, and coronae on Venus.
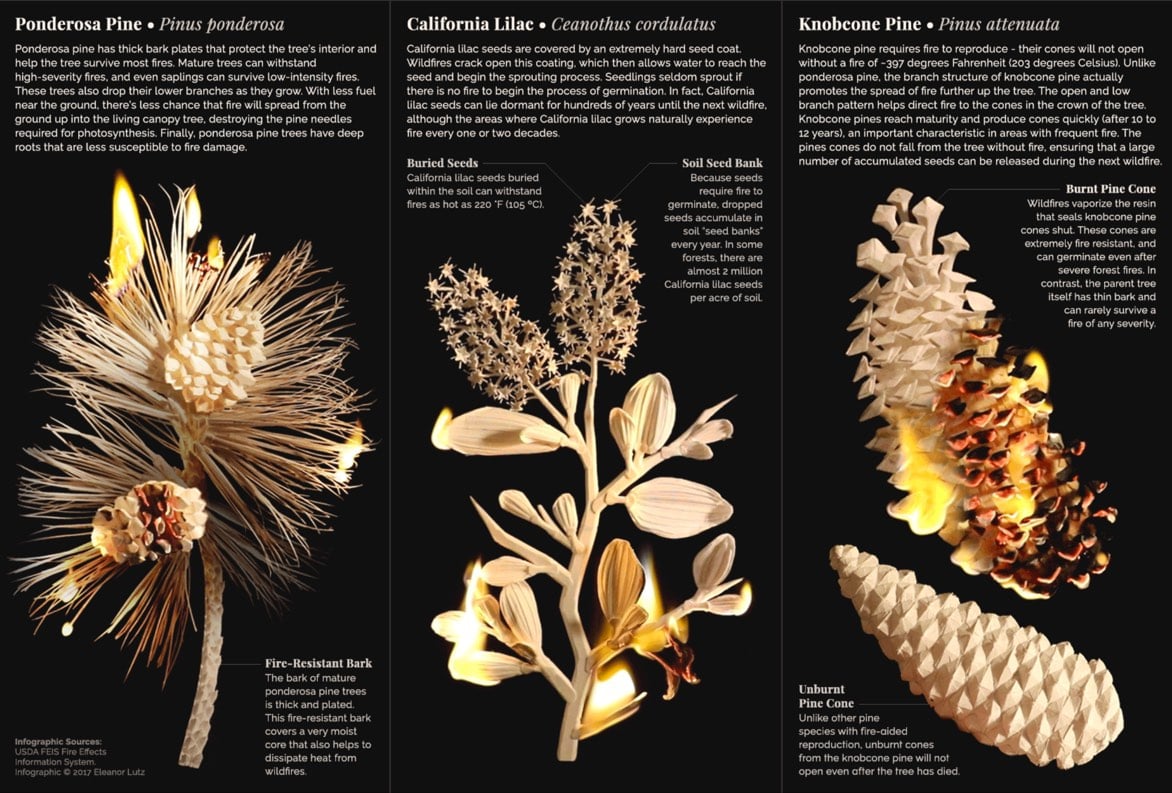
Eleanor Lutz made these nifty models of California plants that can withstand fire damage out of Elmer’s Glue and watercolor paper. She then photographed them burning for this infographic on how some species have adapted to California’s wildfires. Be sure to click through to see the animated version.

This is a lovely infographic from Eleanor Lutz of a bunch of different heartbeat EKG waves, from a normal heartbeat to a flatline to ventricular fibrillation (“must be treated immediately with CPR and defibrillation”.) Prints are available.
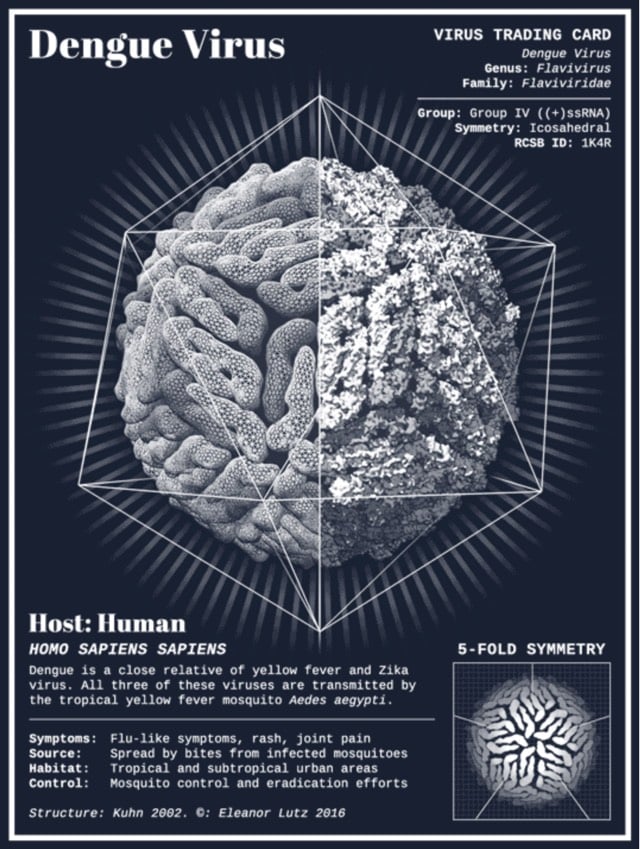
Eleanor Lutz’s latest infographic creation is a set of animated virus trading cards.
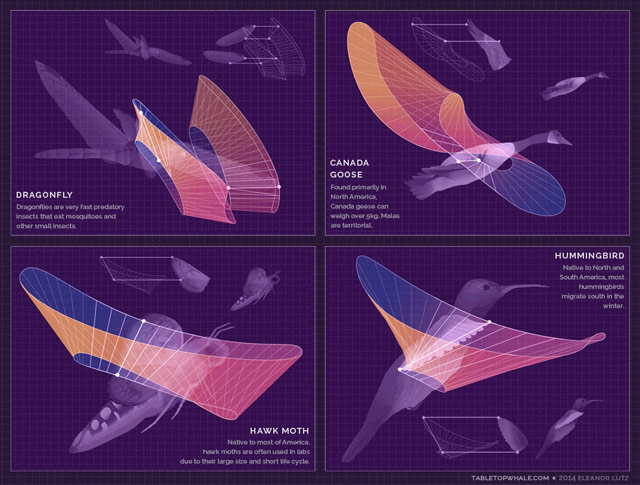
Eleanor Lutz has a degree in molecular biology, works as a designer, and loves to combine the two interests by making these wonderful information graphics on her site, Tabletop Whale. Her most recent post is an animated graphic showing how several animals (birds, bats, insects) move their wings while flying.
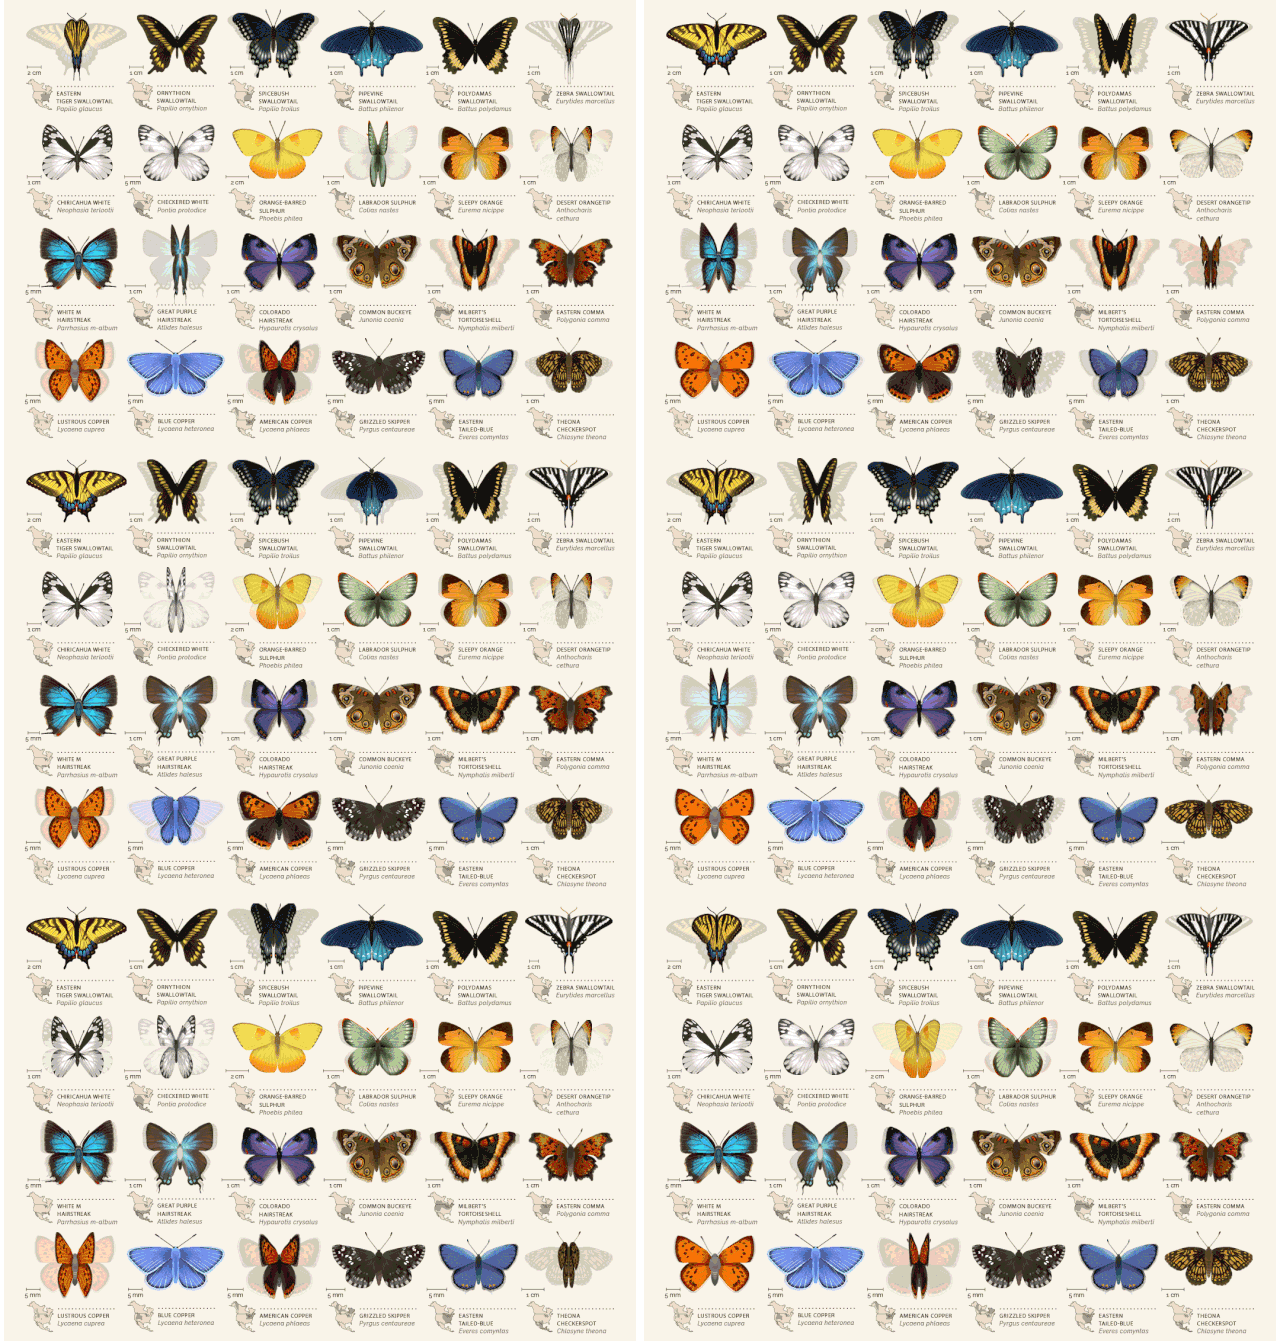
I love love love Lutz’s animated chart of North American butterflies. So playful!
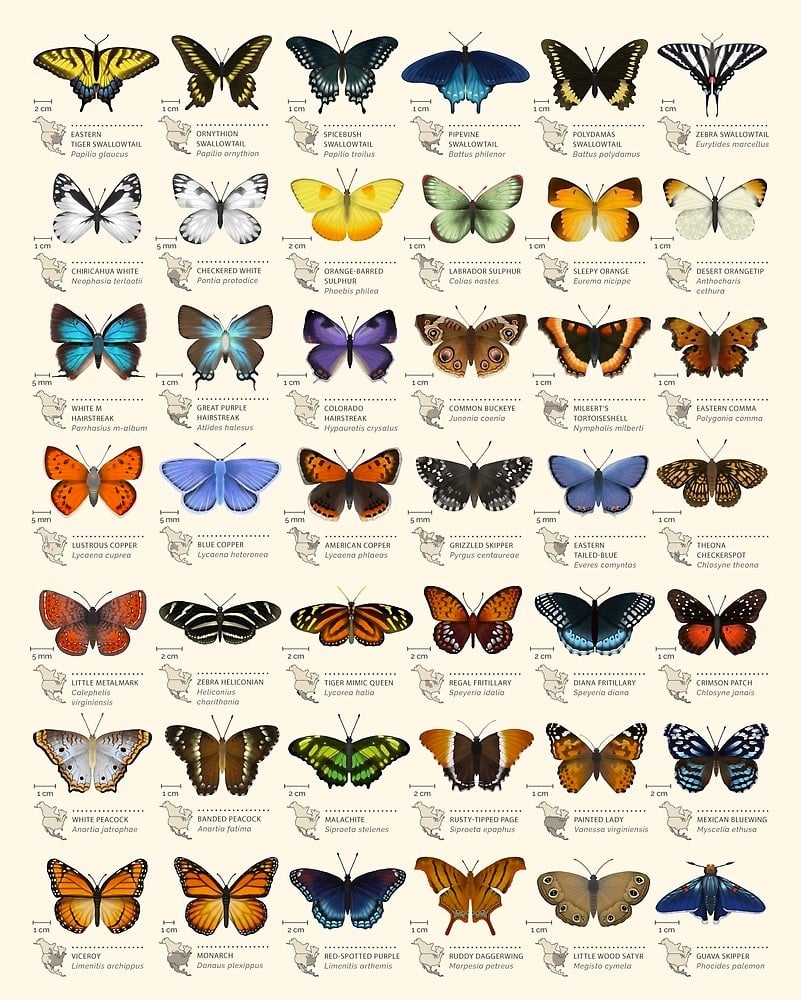
There are only four posts on the site so far, but she’s done other stuff as well; this woodcut map for instance. Prints are available…I’m getting one of the butterflies for sure.









Stay Connected