The Covid-19 Crystal Ball: Estimating Future Deaths from Today’s Reported Cases
On Friday, November 13, 170,792 new cases of Covid-19 were reported in the United States. About 3000 of those people will die from their disease on Dec 6 — one day of Covid deaths equal to the number of people who died on 9/11. It’s already baked in, it’s already happened. Here’s how we know.
The case fatality rate (or ratio) for a disease is the number of confirmed deaths divided by the number of confirmed cases. For Covid-19 in the United States, the overall case fatality rate (CFR) is 2.3%. That is, since the beginning of the pandemic, 2.3% of those who have tested positive for Covid-19 in the US have died. In India, it’s 1.5%, Germany is at 1.6%, Iran 5.5%, and in Mexico it’s a terrifying 9.8%.
A recent analysis by infectious disease researcher Trevor Bedford tells us two things related to the CFR.
1. Reported deaths from Covid-19 lag behind reported cases by 22 days. Some deaths are reported sooner and some later, but in general it’s a 22-day lag.1
2. The overall CFR in the US is 2.3% but if you use the 22-day lag to calculate what Bedford calls “a lag-adjusted case fatality rate”, it’s a pretty steady average of 1.8% since August. Here’s a graph:
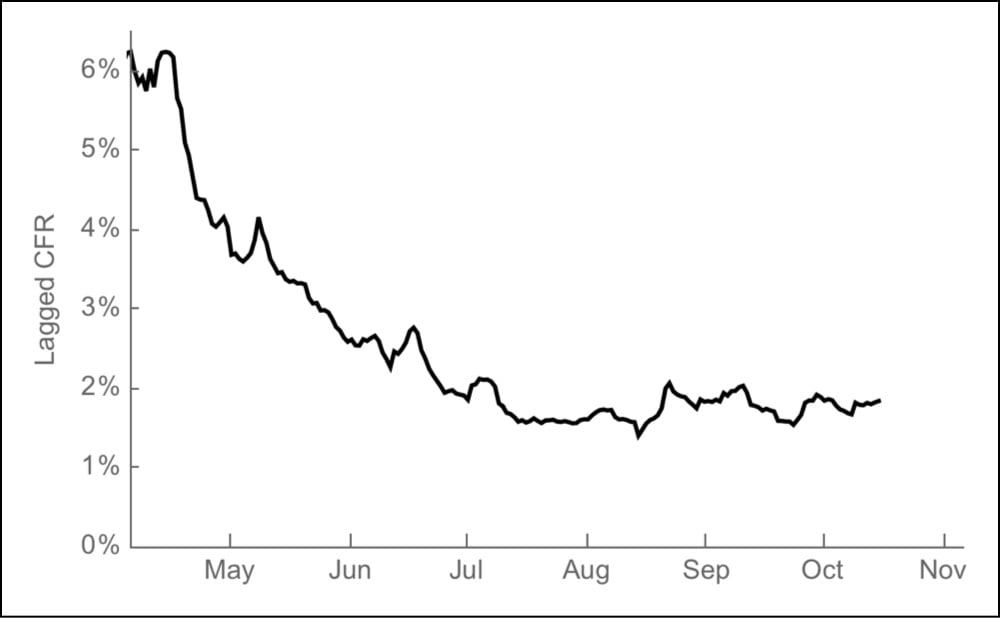
As you can see, in the early days of the pandemic, 4-6% of the cases ended in death and now that’s down to ~1.8%. That’s good news! The less good news is that the current case rate is high and rising quickly. Because of the lag in reported deaths, the rise in cases might not seem that alarming to some, even though those deaths will eventually happen. What Bedford’s analysis provides is a quick way to estimate the number of deaths that will occur in the future based on the number of cases today: just multiply the number of a day’s cases by 1.8% and you get an estimated number of people who will die 22 days later.2
For instance, as I said above, 170,792 cases were reported on Nov 13 — 1.8% is 3074 deaths to be reported on December 6. Cases have been over 100,000 per day for 11 days now: here are the estimated deaths from that time period:
| Date | Cases | Est. deaths (on date) |
|---|---|---|
| 2020-11-15 | 145,670 | 2622 (2020-12-08) |
| 2020-11-14 | 163,473 | 2943 (2020-12-07) |
| 2020-11-13 | 170,792 | 3074 (2020-12-06) |
| 2020-11-12 | 150,526 | 2709 (2020-12-05) |
| 2020-11-11 | 144,499 | 2601 (2020-12-04) |
| 2020-11-10 | 130,989 | 2358 (2020-12-03) |
| 2020-11-09 | 118,708 | 2137 (2020-12-02) |
| 2020-11-08 | 110,838 | 1995 (2020-12-01) |
| 2020-11-07 | 129,191 | 2325 (2020-11-30) |
| 2020-11-06 | 125,252 | 2255 (2020-11-29) |
| 2020-11-05 | 116,153 | 2091 (2020-11-28) |
| 2020-11-04 | 103,067 | 1855 (2020-11-27) |
| Totals | 1,609,158 | 28,965 |
Starting the day after Thanksgiving, a day traditionally called Black Friday, the 1.6 million positive cases reported in the past 12 days will result in 2-3000 deaths per day from then into the first week of December. Statistically speaking, these deaths have already occurred — as Bedford says, they are “baked in”. Assuming the lagged CFR stays at ~1.8% (it could increase due to an overtaxed medical system) and if the number of cases keeps rising, the daily death toll would get even worse. As daily case totals are reported, you can just do the math yourself:
number of cases × 0.018
200,000 cases in a day would be ~3600 deaths. 300,000 daily cases, a number that would have been inconceivable to imagine in May but is now within the realm of possibility, would result in 5400 deaths in a single day. Vaccines are coming, there is hope on the horizon. But make no mistake: this is an absolute unmitigated catastrophe for the United States.
Update: Over at The Atlantic, Alexis Madrigal and Whet Moser took a closer look at Bedford’s model, aided by Ryan Tibshirani’s analysis.
Tibshirani’s first finding was that the lag time between states was quite variable-and that the median lag time was 16 days, a lot shorter than the mean. Looking state by state, Tibshirani concluded, it seemed difficult to land on an exact number of days as the “right” lag “with any amount of confidence,” he told us. Because cases are rising quickly, a shorter lag time would mean a larger denominator of cases for recent days — and a lower current case-fatality rate, something like 1.4 percent. This could mean fewer overall people are dying.
But this approach does not change the most important prediction. The country will still cross the threshold of 2,000 deaths a day, and even more quickly than Bedford originally predicted. Cases were significantly higher 16 days ago than 22 days ago, so a shorter lag time means that those higher case numbers show up in the deaths data sooner. Even with a lower case-fatality rate, deaths climb quickly. Estimating this way, the country would hit an average of 2,000 deaths a day on November 30.
The other major finding in Tibshirani’s analysis is that the individual assumptions and parameters in a Bedford-style model don’t matter too much. You can swap in different CFRs and lag-time parameters, and the outputs are more consistent than you might expect. They are all bad news. And, looking retrospectively, Tibshirani found that a reasonable, Bedford-style lagged-CFR model would have generated more accurate national-death-count predictions than the CDC’s ensemble model since July.
Courtesy of Ed Yong, the lag between cases and hospitalizations is about 11 days. So the full ICUs and packed ERs were hearing about now are going to get so much worse in the next two weeks. And just think about the potential situation a month from now if cases keep rising at the rate they are now for two more weeks…↩
Just to stress again: this is only an estimate. The real reported deaths from a single day’s reported cases will be spread out over several days or weeks. And case reporting is much lower on Sundays and Mondays than on other days (fewer reports on weekends). Bedford accounted for this in his analysis by using 7-day averages.↩
Socials & More