The New US Climate Normals

Every 10 years, the National Oceanic and Atmospheric Administration (NOAA) updates its definition of what it defines as “normal” weather.
As soon as the 2021 New Year’s celebrations were over, the calls and questions started coming in from weather watchers: When will NOAA release the new U.S. Climate Normals? The Normals are 30-year averages of key climate observations made at weather stations and corrected for bad or missing values and station changes over time. From the daily weather report to seasonal forecasts, the Normals are the basis for judging how temperature, rainfall, and other climate conditions compare to what’s normal for a given location in today’s climate.
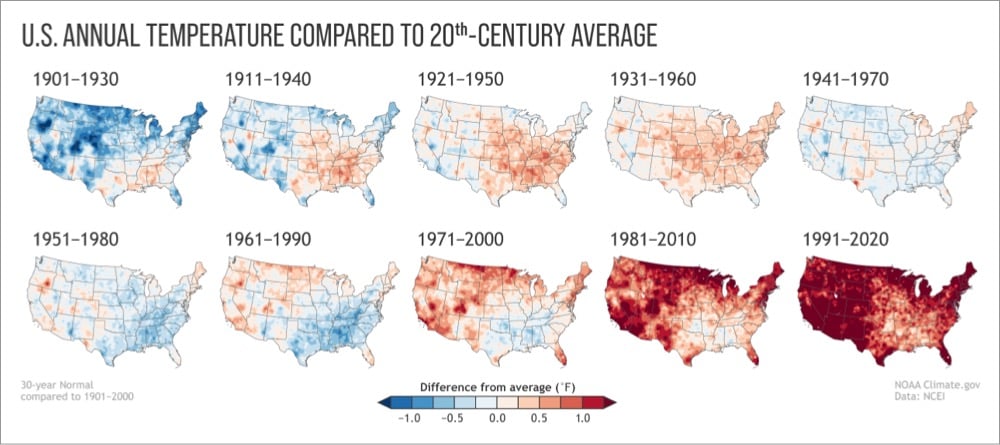
They’re set to release the updated 1991-2020 Normals in early May and, crucially, these new normal climate conditions are not adjusted for climate change.
The last update of the Normals took place in 2011, when the baseline shifted from 1971-2000 to 1981-2010. Among the highlights of the rollout was the creation of a map showing how climate-related planting zones across the contiguous United States had shifted northward in latitude and upward in elevation. It was a clear signal that normal overnight low temperatures across the country were warmer than they used to be.
The planting zone maps emphasized a key point about the Normals and climate change: the once-per-decade update means these products gradually come to reflect the “new normal” of climate change caused by global warming. What’s normal today is often very different than what was normal 50 or 100 years ago. This gradual adjustment is the point: the purpose of the Normals is to provide context on what climate is like today, not how it’s changing over time.
This is literally shifting baselines in action.
So what are shifting baselines? Consider a species of fish that is fished to extinction in a region over, say, 100 years. A given generation of fishers becomes conscious of the fish at a particular level of abundance. When those fishers retire, the level is lower. To the generation that enters after them, that diminished level is the new normal, the new baseline. They rarely know the baseline used by the previous generation; it holds little emotional salience relative to their personal experience.
And so it goes, each new generation shifting the baseline downward. By the end, the fishers are operating in a radically degraded ecosystem, but it does not seem that way to them, because their baselines were set at an already low level.
Over time, the fish goes extinct — an enormous, tragic loss — but no fisher experiences the full transition from abundance to desolation. No generation experiences the totality of the loss. It is doled out in portions, over time, no portion quite large enough to spur preventative action. By the time the fish go extinct, the fishers barely notice, because they no longer valued the fish anyway.
I’ve been thinking a lot about shifting baselines recently — specifically in terms of how quickly people in the US got used to thousands of people dying from Covid every day and became unwilling to take precautions or change behaviors that were deemed essential just months earlier when many fewer people were dying. See also mass shootings.


Stay Connected