The Information Visualization Revolution
For the New Yorker, Hannah Fry wrote a brief history of information visualization, a quiet innovation that has changed the world:
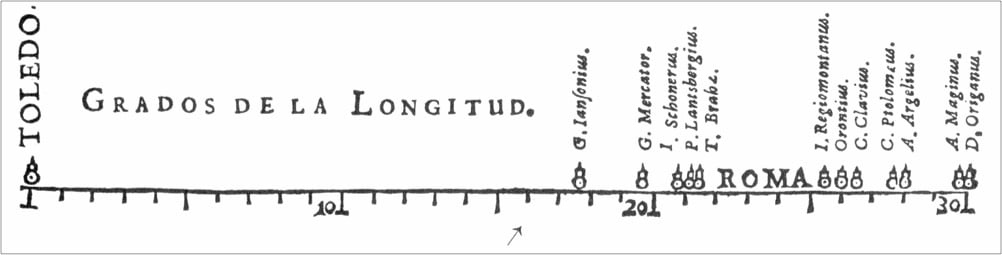
Van Langren could have put these values in a table, as would have been typical for the time, but, as Friendly and Wainer observe, “only a graph speaks directly to the eyes.” Once the numbers were visualized, the enormous differences among them — and the stakes dependent on those differences — became impossible to ignore. Van Langren wrote, “If the Longitude between Toledo and Rome is not known with certainty, consider, Your Highness, what it will be for the Western and Oriental Indies, that in comparison the former distance is almost nothing.”
Van Langren’s image marked an extraordinary conceptual leap. He was a skilled cartographer from a long line of cartographers, so he would have been familiar with depicting distances on a page. But, as Tufte puts it, in his classic study “Visual Explanations” (1997), “Maps resemble miniature pictorial representations of the physical world.” Here was something entirely new: encoding the estimate of a distance by its position along a line. Scientists were well versed in handling a range of values for a single property, but until then science had only ever been concerned with how to get rid of error — how to take a collection of wrong answers and reduce its dimension to give a single, best answer. Van Langren was the first person to realize that a story lay in that dimension, one that could be physically seen on a page by abstracting it along a thin inked line.
Van Langren’s graph, which Fry says “might be the first statistical graph in history”, is pictured at the top of this post.
Socials & More