The Pantone Pee Chart
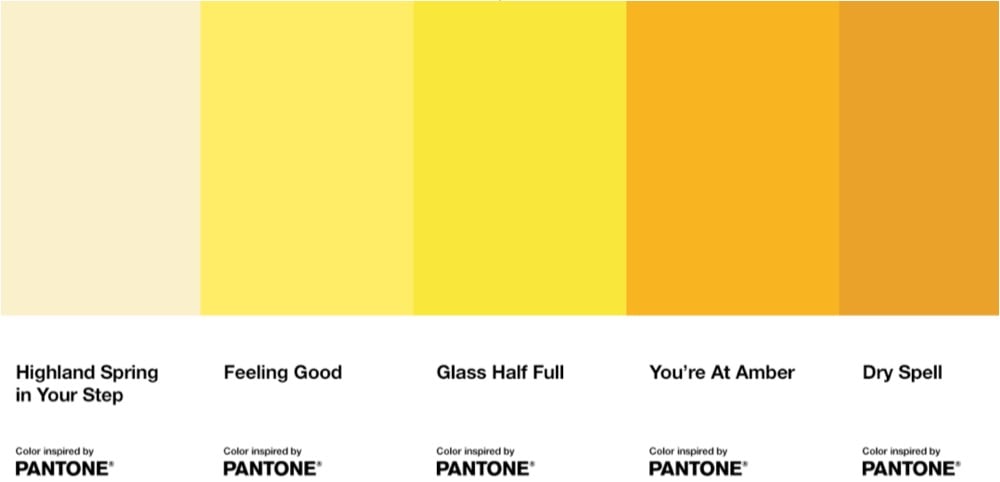
Urine color is an indicator of how hydrated you are and Pantone are the color experts, so of course they’ve teamed up with a Scottish bottled water company to produce a chart with 5 color gradations that help you determine your hydration level. But 10 glasses of water a day?! I’m not sure the science supports that, particularly since we get a lot of our recommended intake from regular food & beverage consumption.
It remains unclear where the “8 x 8” water intake recommendation comes from. Perhaps, this two-liter intake threshold is derived from a misinterpretation of original recommendations offered by the U.S. Food and Nutrition Board in 1945 as well as the 2017 European Food Safety Authority, which states the daily recommended amount of water includes all beverages plus the moisture contained in foods.
This means that the moisture contained in foods, especially fresh fruits, sodas, juices, soups, milk, coffee and, yes, even beer, contributes to this daily recommended water requirement. These guidelines go on to suggest that most of the recommended water content can be accomplished without drinking additional cups of plain water.
(via print)


Stay Connected