Climate change is shifting cherry blossom peak-bloom times
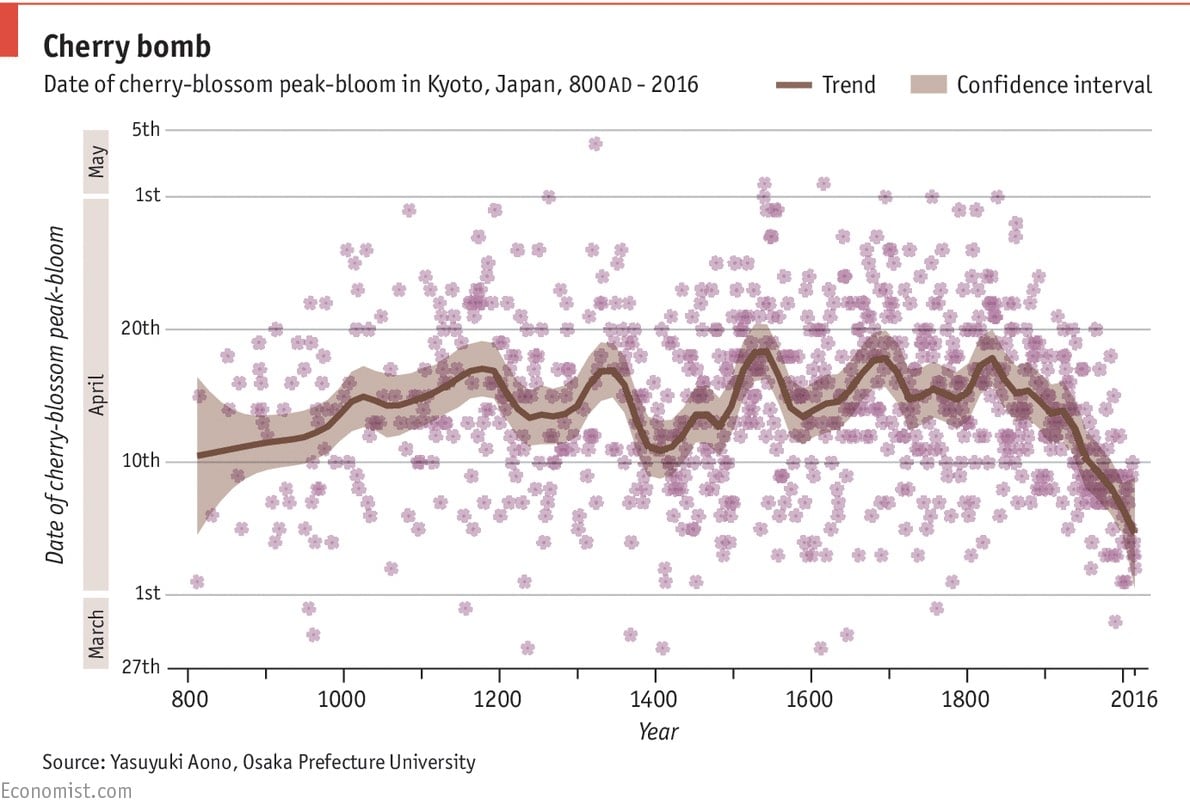
Records of when the cherry blossoms appear in Kyoto date back 1200 years. (Let’s boggle at this fact for a sec…) But as this chart of peak-bloom dates shows, since the most recent peak in 1829, the cherry blossoms have been arriving earlier and earlier in the year.
From its most recent peak in 1829, when full bloom could be expected to come on April 18th, the typical full-flowering date has drifted earlier and earlier. Since 1970, it has usually landed on April 7th. The cause is little mystery. In deciding when to show their shoots, cherry trees rely on temperatures in February and March. Yasuyuki Aono and Keiko Kazui, two Japanese scientists, have demonstrated that the full-blossom date for Kyoto’s cherry trees can predict March temperatures to within 0.1°C. A warmer planet makes for warmer Marches.
Temperature and carbon-related charts like this one are clear portraits of the Industrial Revolution, right up there with oil paintings of the time. I also enjoyed the correction at the bottom of the piece:
An earlier version of this chart depicted cherry blossoms with six petals rather than five. This has been amended. Forgive us this botanical sin.
Gotta remember that flower petals are very often numbered according to the Fibonacci sequence.
Socials & More