Alex Reisner’s cabinet of statistical wonders
While bumping around on the internet last night, I stumbled upon Alex Reisner’s site. Worth checking out are his US roadtrip photos and NYC adventures, which include an account and photographs of a man jumping from the Williamsburg Bridge.
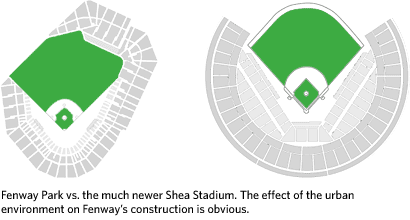
But the real gold here is Reisner’s research on baseball…a must-see for baseball and infographics nerds alike. Regarding the home run discussion on the post about Ken Griffey Jr. a few weeks ago, Reisner offers this graph of career home runs by age for a number of big-time sluggers. You can see the trajectory that Griffey was on before he turned 32/33 and how A-Rod, if he stays healthy, is poised to break any record set by Bonds. His article on Baseball Geography and Transportation details how low-cost cross-country travel made it possible for the Brooklyn Dodgers and New York Giants to move to California. The same article also riffs on how stadiums have changed from those that fit into urban environments (like Fenway Park) to more symmetric ballfields built in suburbs and other open areas accessible by car.

And then there’s the pennant race graphs for each year since 1900…you can compare the dominance of the 1927 Yankees with the 1998 Yankees. And if you’ve gotten through all that, prepare to spend several hours sifting through all sorts of MLB statistics, represented in a way you may not have seen before:
The goal here is not to duplicate excellent resources like Total Baseball or The Baseball Encyclopedia, but to take the same data and present it in a way that shows different relationships, yields new insights, and raises new questions. The focus is on putting single season stats in a historical context and identifying the truly outstanding player seasons, not just those with big raw numbers.
Reisner’s primary method of comparing players over different eras is the z-score, a measure of how a player compares to their contemporaries, (e.g. the fantastic seasons of Babe Ruth in 1920 and Barry Bonds in 2001):
In short, z-score is a measure of a player’s dominance in a given league and season. It allows us to compare players in different eras by quantifying how good they were compared to their competition. It it a useful measure but a relative one, and does not allow us to draw any absolute conclusions like “Babe Ruth was a better home run hitter than Barry Bonds.” All we can say is that Ruth was more dominant in his time.
I’m more of a basketball fan than of baseball, so I immediately thought of applying the same technique to NBA players, to shed some light on the perennial Jordan vs. Chamberlain vs. Oscar Robertson vs. whoever arguments. Until recently, the NBA hasn’t collected statistics as tenaciously as MLB has so the z-score technique is not as useful, but some work has been done in that area.
Anyway, great stuff all the way around.
Update: Reisner’s site seems to have gone offline since I wrote this. I hope the two aren’t related and that it appears again soon.
Update: It’s back up!


Stay Connected